
U.S. Investment in Machine Tools Poised to Reach Remarkable Level
Spending on machine tools is projected to be way up next year. The latest Capital Spending survey indicates an eye-popping 37 percent increase in capital equipment purchases in 2015. What does this mean to you?
.JPG;width=70;height=70;mode=crop;format=webp)


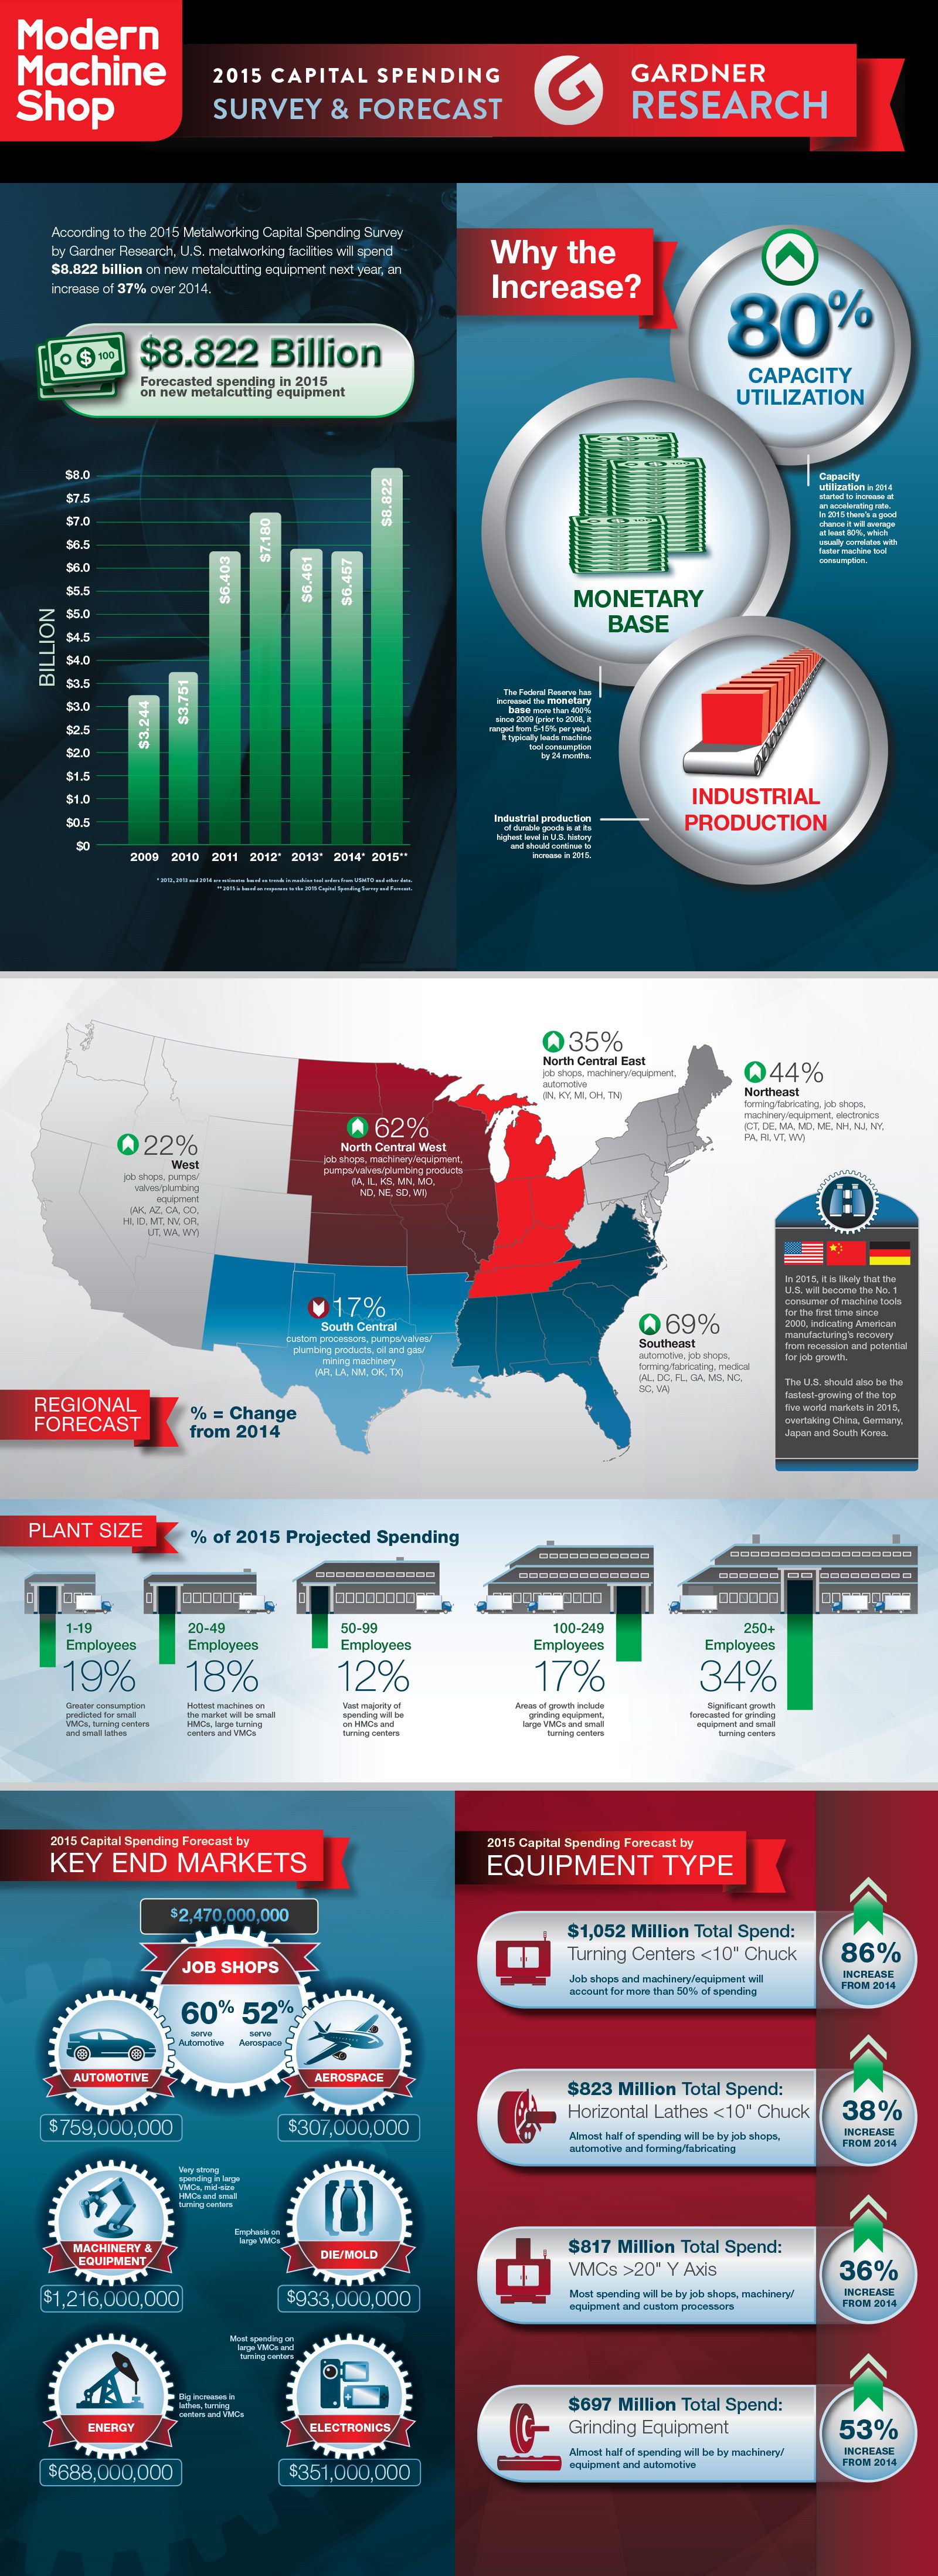
United States manufacturing companies say they plan to invest heavily—very heavily—in machine tools and related manufacturing technology in 2015. In fact, a recent survey of equipment buyers predicts an increase of 37 percent in spending over last year’s levels.


This past July and August, Gardner Business Media surveyed readers of this magazine and three of its sister publications, asking them about their plans for spending on metalworking capital equipment, workholding and tooling in 2015. Based on the responses to this Capital Spending Survey, we forecast spending by industry on specific machine, workholding and tooling types.
How believable is this projected increase in machine tool spending for 2015? Consider this:
- According to the U.S. Federal Reserve, capacity utilization at auto parts manufacturers was at 88 percent in July—the highest level in 25 years. This high rate of capacity utilization reflects the fact that automakers are busier than they have been in years. More models, higher vehicle sales and production, stepped-up marketing, and easy-to-get below-prime car loans are some reasons car and truck sales are up.
- The staggering number of new car models set to begin production in the next few years means a lot more plastic injection molding capacity is needed. Also, the complexity of molds is increasing as automakers design distinctive features into bumpers, taillights and other plastic parts.
- Airplane builders have booked record numbers of orders. Aerospace orders were up a whopping 387 percent in July. After years of declining ridership, airlines need to buy more planes that are fuel efficient and comfortable for travelers.
- Medical companies are scrambling to keep pace with an aging population here and abroad. People are getting older and as they do, knees, hips and backbones are wearing out.
- Gas and oil are now plentiful in our own backyard, and we are intent on extracting these resources cleanly and committed to using them in an environmentally responsible way. But the United States lacks the infrastructure, whether pipelines or railcars, to move the fuel to where it can be used or exported. Major investments are being made to correct that.
- Reshoring and near-shoring are trends that are picking up momentum. Having production facilities and factories close by is proving to be a smart strategy again.
If you or your company are thinking about buying machine tools next year, you should take these projections seriously. For one thing, they show that you are not alone in your confidence to invest in manufacturing in this country. For another, these projections mean that you may have to wait longer and pay more for the machine tool that you need to get on your shop floor. In addition, you should look closely at what other companies (and your competitors) are buying as the type of manufacturing resource that they consider the best investment right now.
Let’s take a closer look at the economic indicators that make a huge increase in spending a very credible possibility (and acknowledge along the way the factors that could significantly change these rosy projections). Let’s also take a closer look at what you should do in response.
Finally, let’s think about what it means to see the United States return to its position as the largest consumer of machine tools in the world, a position it has not held since 2000. This possibility is also in the offing.
Some Historical Perspective
The Capital Spending Survey is forecasting machine tool consumption of $8.8 billion in 2015. This would be the highest level of spending in more than a decade (see Chart 1 below). But machine tool spending was higher than $8 billion (inflation-adjusted) for six straight years from 1995 to 2000, and nearly half the time from 1965 to 1980. Although this level of spending is unprecedented in this century, it is a relatively common occurrence in the history of the machine tool industry since World War II.
Even a 37 percent increase in consumption from one year to the next is not that unusual. This has occurred 14 times since 1937. Moreover, it’s not unusual to see large increases from elevated levels of spending either. The average increase in machine tool consumption since 1937 is 30 percent. So, the 37 percent increase projected for 2015 is just a little more than the historical average. Of course, these dramatic increases from year to year are counterbalanced by dramatic decreases, which is why the machine tool industry is considered a classic example of a cyclical industry by many economists.

Leading Indicators All Positive
As Gardner’s director of market intelligence, I track four leading indicators of machine tool consumption: the monetary base, capacity utilization, the Gardner Business Index and industrial production. All four of these indicators are pointing to significantly higher machine tool consumption in 2015, but we will highlight two of them—arguably the two more important ones—here.
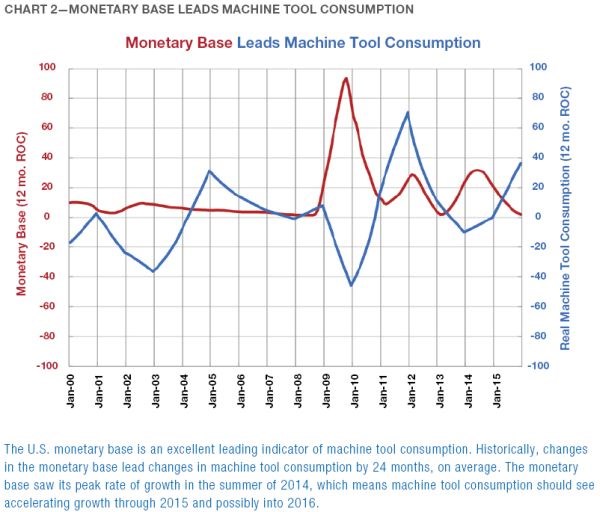
The monetary base. (Basically, the monetary base is the total amount of physical currency in circulation. It is virtually equivalent to the assets on the Federal Reserve’s balance sheet. The Fed controls the monetary base by controlling the assets it owns.) When the Federal Reserve pumps more money into the economy, it generally leads to higher machine tool consumption. Prior to 2008, the annual rate of change in the monetary base ranged from roughly 5 to 15 percent. Since the financial collapse in late 2008, the Federal Reserve has increased the U.S. monetary base by more than 400 percent, so the annual rate of change has stayed above 15 percent for nearly five straight years (see Chart 2 above) with peak rates of growth higher than 28 percent three separate times during this period. This dramatic surge in the monetary base has spurred significant increases in machine tool consumption in recent years. Typically, changes in the monetary base lead changes in machine tool consumption by 24 months. With the monetary base hitting its peak rate of growth in the summer of 2014, machine tool consumption should see accelerating growth through 2015 and perhaps into 2016.
While the fantastic rate of growth in the money supply has helped manufacturing and, to some extent, the entire economy in the short term, it is a disastrous policy for the long term. At some point in time, the money printing will have to end. In October, the Federal Reserve was scheduled to end quantitative easing (a policy by which the Fed injects money into the economy by purchasing securities, typically government bonds, with electronic money that did not exist previously). Will this cause interest rates to rise? The U.S. dollar to rise against other currencies? The stock market to fall? If any of these events happen to a significant degree, then will the Federal Reserve reinstitute some form of quantitative easing? The answers to these difficult questions will likely have a major impact on investment in machine tools in the upcoming years.
Capacity utilization. Of course, most manufacturers are not sitting around watching the monetary base as an indicator of when they should buy capital equipment. Most shops make investment decisions based on capacity utilization—how busy existing equipment is right now. Generally, the Capital Spending Survey shows that the need to increase capacity has been the No. 1 motivator for shops to buy a new machine tool. This finding has not changed in 25 years.
In factories producing durable goods, capacity utilization is at its highest level since early 2008 and has been increasing at an accelerating rate. Factories are getting busier at a quicker and quicker pace. This accelerating growth is likely to continue, based on the correlation between backlogs in our business index and capacity utilization. I think durable goods capacity utilization will reach 80 percent in 2015 for the first time since June 2000, and durable goods capacity utilization could average more than 80 percent for the first time since 1998.
The rule of thumb is that machine tool consumption really takes off when capacity utilization goes over 80 percent, and a scatter plot (see Chart 3 below) of these two factors shows a high degree of correlation. The best-fit curve is exponential, showing that machine tool consumption does indeed rise faster when capacity utilization exceeds 80 percent. About 60 percent of the time that capacity utilization is above 80 percent, machine tool consumption is more than $8 billion, and there are even a few instances when it still rises above that figure even when capacity utilization falls just shy of 80 percent.

A Reversal in Machine Types
Based on higher spending levels or stronger rates of growth, the 2013 and 2014 Capital Spending Surveys showed that shops favored milling over turning machines, horizontal over vertical machines, and larger over smaller machines. However, these trends stand to do a 180-degree reversal in 2015. According to this year’s survey, shops will favor turning over milling machines, vertical over horizontal machines, and smaller over larger machines next year. Of course, the types of machines shops plan to buy are dictated by the types of parts they expect to be making.
Table 1 below, shows the breakdown of purchases in the major machine tool categories for the last several years. Machining center purchases should continue to rank the highest, representing more than 35 percent of total consumption. Within that machining center category, spending on vertical machines will draw even with horizontal machines for the first time since 2012. Within the vertical machining center category, spending will be evenly split between machines with a Y axis smaller than 20 inches and those with a Y axis larger than 20 inches. Horizontal machining centers with pallets smaller than 400 mm should grow in 2015, but larger machines will see less spending.
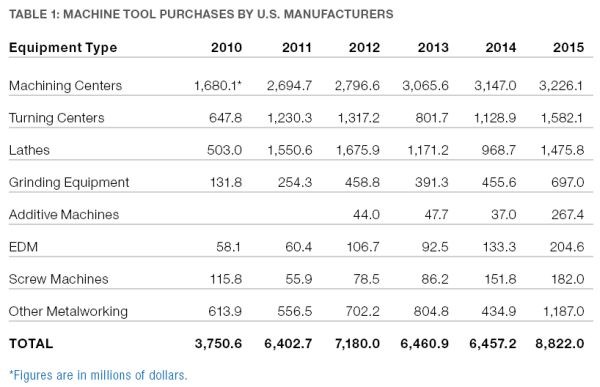
The turning center market is typically 90 percent horizontal and 10 percent vertical machines. That should remain true in 2015. However, spending on turning centers with a less-than-10-inch chuck will double in 2015 while spending on larger turning centers will remain flat.
Spending on vertical lathes should double in 2015, but these types of machines represent only 13 to 15 percent of the total lathe market. Within the horizontal lathe category, spending will be much greater on those machines with a chuck smaller than 10 inches.
According to the survey, spending on grinding machines in 2015 will be more than five times what it was in 2010. The majority of this spending will be evenly divided among a few machine types: cylindrical/external, centerless, flat/surface and other. Shops plan to spend between $125 and $150 million on each of these types of grinding equipment.
The increased forecast for the purchase of additive manufacturing machines in 2015 stands out. Trying to forecast a spending level for additive machines is very difficult, because the use of these machines is low but has the potential to grow rapidly. What the survey does tell us is that interest among buyers for additive manufacturing machines is increasing rapidly. The survey included one new machine category this year to capture the combination milling/laser sintering machines that are hitting the market. Spending in this category is projected to be more than $100 million for 2015. However, it is likely that the builders will not be able to make enough of these machines for spending to actually reach that level.
Also, it’s important to note that spending on ancillary or special-purpose machines (see the “Other” category) will increase significantly in 2015. These include drilling/tapping, transfer/special purpose, sawing/cutoff, and laser cutting machines.
The Hot Industries
The Capital Spending Survey forecasts machine tool spending among more than 20 industries. Buyers in virtually every one of these industries are planning to spend more on machine tools in 2015. This should be no surprise, considering that the survey is calling for a 37 percent increase in total machine tool consumption. Here, we highlight the five largest industries, each of which will spend more than $500 million on machine tools next year.
- Metalcutting job shops. Metalcutting job shops are forecast to spend almost $2.5 billion on machine tools next year. That figure is roughly double the next largest end market. Job shops are always the largest end market for machine tools because they greatly outnumber metal-cutting facilities in the other industry segments. Based on Gardner Business Media’s plant demographic data, 60 percent of job shops make parts for the automotive industry and 52 percent make parts for the aerospace industry. Therefore, one reason for the expected increase in spending by job shops is the improvement in the automotive and aerospace industries mentioned earlier. Also, there seems to be a continuing trend in these two industries and others such as energy for work to be pushed down the supply chain. This is creating new business for job shops that requires increased capacity—hence the need to purchase new machine tools. In general, job shops say they will significantly increase their spending on small turning centers, vertical machining centers and horizontal machining centers. However, their spending on the larger models of these machines will be either flat or down next year.
- Machinery and equipment manufacturers. In 2015, the second largest buyer of machine tools will be machinery and equipment manufacturers. Total spending on machine tools by this end market will be about half that of job shops, or $1.2 billion, but this is 20 percent more than it spent in 2011, its previous high year. In 2013 and 2014, machine tool manufacturers themselves were responsible for much of the machine tool spending in this end market. That will not be the case in 2015. The big spenders among machinery and equipment manufacturers will be material handling equipment, power-driven hand tool and packaging equipment manufacturers. This end market will dramatically increase its spending on small turning centers, in particular. In addition, spending on vertical machining centers and lathes with a chuck smaller than 10 inches will remain strong.
- Die/mold manufacturers. The die/mold industry as a whole is forecast to spend $933 million, or 50 percent more than it did in 2014, which was a significant increase from 2013. This particular end market does not even show up in our survey results. However, if we add up the spending expected by industrial mold shops, custom processors and plastic/rubber product manufacturers, which are presumably buying machine tools to make molds, we can get an approximate total for expected machine tool spending by the die/mold industry. Die/mold manufacturers should spend significantly more in particular on vertical machining centers with a Y axis larger than 20 inches.
As was mentioned earlier, the increase in new vehicle launches and the increasing complexity of the molded parts on these new models is a major driver of the anticipated increased spending by mold shops. A number of other trends also are driving the increased spending by the die/mold industry, including new and reshored manufacturing facilities in the appliance industry, continued strength in medical parts manufacturing, and reshored mold manufacturing due to poor quality from overseas suppliers.
- The automotive industry. The automotive industry is planning to increase its machine tool spending by almost 50 percent to $759 million next year. The only clear-cut segment within this industry that will be spending a significant amount is gasoline engine manufacturers. Much of the spending in the automotive industry as a whole will come from companies that make a variety of motor vehicle parts. This industry will spend significantly more on a variety of grinding equipment as well as small turning centers. In addition, spending on small lathes should remain quite high.
- Pump, valve and plumbing product makers. One other industry that will spend more than $500 million on machine tools in 2015 is the pumps, valves and plumbing products segment, although the name of this industry category may be misleading. That’s because the spending in this end market is energy-related. Strong segments will include metal valves, fabricated pipe and pipe fittings, plus pumps and compressors. The increase in U.S. oil and natural gas production is now widely recognized. Much of the spending on machine tools for new drilling equipment has already taken place. However, the shortage of pipelines and rail loading facilities to transport fuel will drive a nearly 100-percent increase (to $688 million) in spending by pumps, valves and plumbing products manufacturers. This increased spending will be on turning centers, vertical machining centers and lathes.
What Does It All Mean?
While all the leading indicators in the United States are pointing in a positive direction for machine tool consumption, that’s not the case in the other four countries that round out the top five. Most or all of the leading indicators are pointing toward slower growth in machine tool consumption in Japan and South Korea and contraction in China and Germany. If our forecast proves accurate, then it is likely that the United States will be the world’s biggest machine tool consumer in 2015. It has not held this spot since 2000.
Why is this important? First, it would show that American manufacturing has made a dramatic recovery from the two recessions we’ve already experienced this century. In fact, one could argue convincingly that this level of investment is needed to support the current level of durable goods production, which is the highest it’s ever been in the history of the country.
Second, this level of investment indicates the importance of American manufacturing to the U.S. economy. Sure, most of the population will not know that America is making an increased investment in machine tools, the most essential and fundamental means to make things. Nor will it grasp how this increase will create wealth to sustain our standard of living. However, more and more observers outside the world of manufacturing are paying attention and making the connection between manufacturing productivity and economic prosperity.
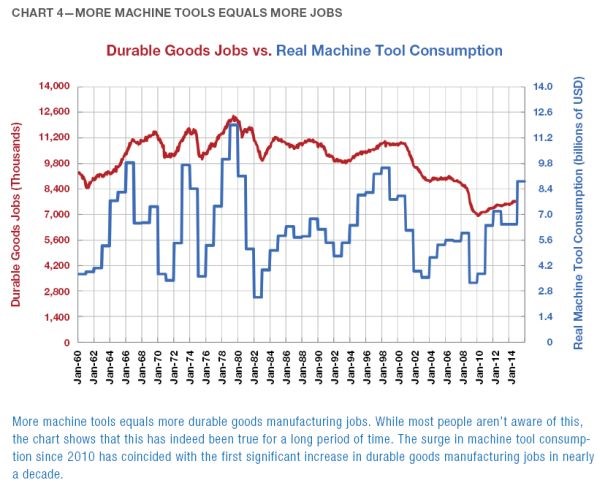
Third, increased investment in capital equipment will result in job growth (see Chart 4 below). Throughout the 1960s and 1970s, as spending on machine tools increased, so did jobs in durable goods manufacturing. Beginning in 1980, as machine tool consumption fell to lower and lower levels, jobs in durable goods manufacturing also declined. Since 2010, as machine tool consumption has increased, durable goods manufacturing jobs have also been increasing. Increased investment in capital equipment leads to higher productivity, which leads to greater profits, which leads to more jobs. Being anti-technology is not a good job-creation policy.
The results of the Capital Spending Survey also are important for you in the short term. First, longer delivery times should be expected as next year progresses. Machine tools take a lengthy time to build, especially if customization and automation are required. Like all other manufacturers, machine tool builders want to keep their inventory as low as possible. So, when demand increases rapidly, as the survey indicates it will, machine tool builders may have a hard time ramping up production fast enough. As orders build up in the pipeline, delivery times typically grow longer and longer. Because a significant number of the machine tools acquired in the U.S. are imported, shipping times from overseas can exacerbate the problem.
Second, machine tool prices are likely to rise during 2015. This is really as simple as supply and demand. When demand for machine tools rises rapidly and builders cannot increase the supply as fast as demand is rising, the price of machines tends to increase to balance out this supply and demand. Historical data for the machine tool market supports this effect. Price increases are even more likely on machine types that the survey indicates will be in higher demand next year. As mentioned earlier, shop preferences are trending to smaller rather than larger machines, vertical mills rather than horizontal, and more turning machines than milling machines.
Third, the longer you wait to buy next year, the more likely it is you will not be able to buy the machine you prefer. You may have to settle for your second or third choice. If you cannot accept the extended delivery time for your preferred machine because you have a new order that must be fulfilled right away, then you will have to settle for the next-best machine that will meet your time frame. If the type of machine you really want is in high demand, then the price could rise to a level that makes your return on investment hard to justify. Wise planners will include detailed contingencies that adjust for accepting that second- or third-best machine tool.
If you know you are going to buy a machine, or multiple machines, next year, then it may be better to buy sooner rather than later to avoid potentially longer delivery times and higher prices. It could be a good tactic for staying one step ahead of the competition.


Read Next

The Cut Scene: The Finer Details of Large-Format Machining
Small details and features can have an outsized impact on large parts, such as Barbco’s collapsible utility drill head.
Read More

3 Mistakes That Cause CNC Programs to Fail
Despite enhancements to manufacturing technology, there are still issues today that can cause programs to fail. These failures can cause lost time, scrapped parts, damaged machines and even injured operators.
Read More