
Jan. 2010 Machine Tool Sales Show Significant Growth
According to the USMTC, January 2010 machine tool sales were up 14% and 38% compared to January 2009 in units and dollars, respectively.
.JPG;width=70;height=70;mode=crop;format=webp)
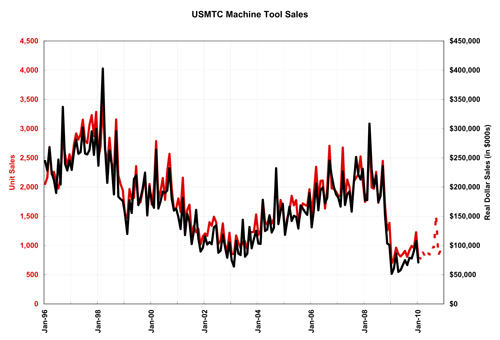
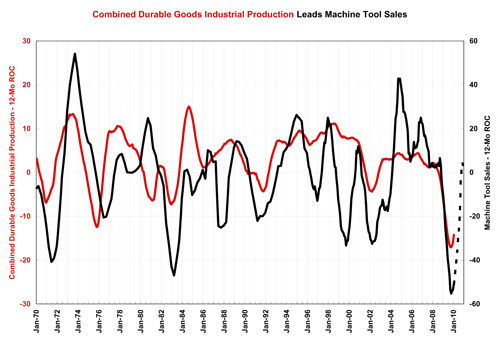


According to the USMTC, January 2010 machine tool sales were up 14% and 38% compared to January 2009 in units and dollars, respectively. This is the first time that unit sales were up month over month since September 2008, and this is the second month in a row that real dollar sales have seen an increase month over month. While I’m still skeptical about the long-term prospects for the economy, there is no doubt that machine tools have hit bottom and are starting to move in a positive direction. The first chart shows unit sales and dollar sales as reported by USMTC. (I show real dollar sales here while USMTC reports nominal dollar sales.) The dotted red line represents my forecast for machine tool unit sales for 2010. In January my unit forecast (created in October 2009) was just 2% lower than actual unit sales. Keep in mind that the USMTC report doesn’t capture the entire market and that participation in the survey has increased over time.


Read Next


3 Mistakes That Cause CNC Programs to Fail
Despite enhancements to manufacturing technology, there are still issues today that can cause programs to fail. These failures can cause lost time, scrapped parts, damaged machines and even injured operators.
Read More
The Cut Scene: The Finer Details of Large-Format Machining
Small details and features can have an outsized impact on large parts, such as Barbco’s collapsible utility drill head.
Read More