
Nov. 2009 Air Transport Data
The U.S. Department of Transportation has released its data on air transportation for November 2009. The key metric that I focus on in this release is system revenue passenger miles (SRPM). I focus on SRPM because it is a good leading indicator for aerospace industrial production.
.JPG;width=70;height=70;mode=crop;format=webp)
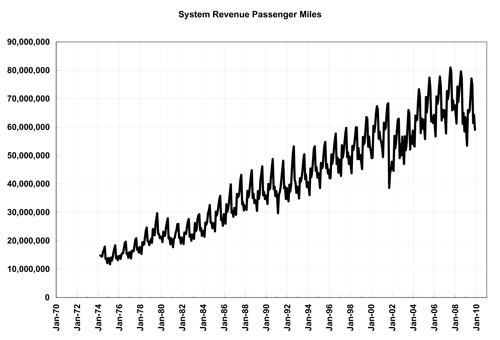


The U.S. Department of Transportation has released its data on air transportation for November 2009. The key metric that I focus on in this release is system revenue passenger miles (SRPM). I focus on SRPM because it is a good leading indicator for aerospace industrial production. SRPM is calculated by multiplying the number of revenue generating passengers on a flight times the number of miles the flight travels. In November 2009, SRPM was a little more than 59 million passenger miles. This was an increase of 1.02% compared to November 2008. This was only the second time that SRPM grew month over month since March 2008.
The first chart to the right shows SRPM since early 1974. A couple of things stand out when viewing this chart. First, the data is highly seasonal. The summer months are the peaks since they represent the height of the travel season due to family vacations. Second, except for a minor slow down in the early ‘80s and the severe drop-off in airline travel after Sept. 11, SRPM has grown consistently until the obvious slowdown that started in 2007. Of course, that is about the same time that current recession began.


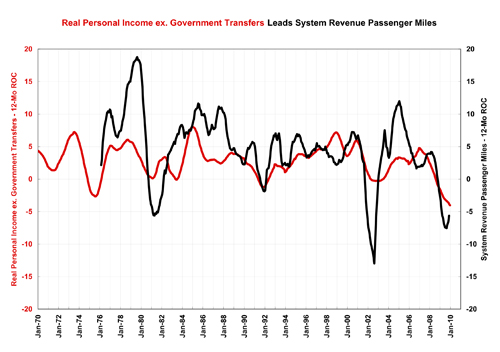
By using 12-month rate of change curves, we find that a good leading indicator for SRPM is real personal income excluding government transfers. As personal incomes go up, people are more willing to go on vacation and vice versa (the same applies for businesses). The second chart on the right shows the relationship between the rate of change curves for income and SRPM for the last 40 years. On average, changes in income lead changes in SRPM by seven months. Currently, we see that incomes continue to contract faster and faster but that SRPM has bottomed out and is contracting more slowly each month. This is rather unusual but is something I’m seeing with all of the income and spending data I’m tracking. This leads to several questions going forward: 1) Can SRPM continue to contract more slowly even if incomes continue to contract faster? 2) If incomes continue to contract faster, will SRPM start to contract faster? 3) Will incomes start to contract more slowly causing SRPM to move up even faster? Based on past history, one would expect SRPM to contract faster unless we see a slowdown in the rate of contraction for incomes soon.
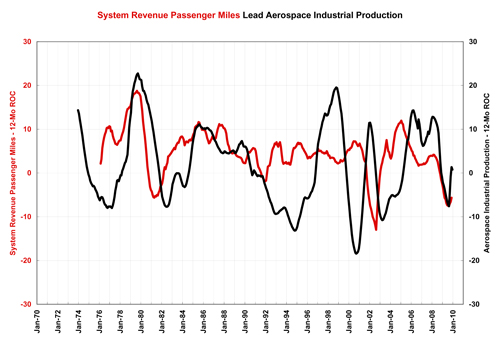
We can also correlate SRPM to aerospace industrial production, a significant area of business for metalworking facilities. The third chart on the right shows the relationship between SRPM and aerospace industrial production. On average, changes in SRPM lead changes in aerospace industrial production by 16 months. Here we see that SRPM and aerospace industrial production both reached a bottom in August 2009. However, the depth of the decline and consequent rebound in aerospace industrial production are somewhat exaggerated on this chart due to the strike by Boeing workers in late 2008.


