
Looking To The Economic Future Of Your Business
Trends affecting other trends in available economic data can signal whether more or less activity is coming for your manufacturing business.
.JPG;width=70;height=70;mode=crop;format=webp)


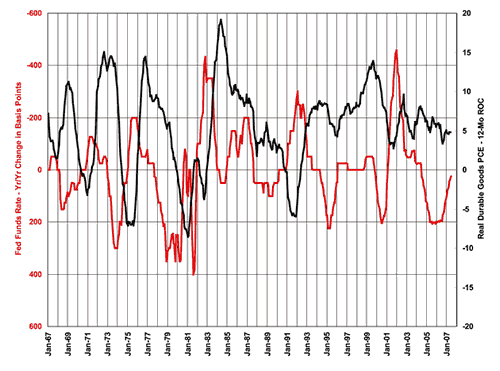
Fig. 4—The Fed Funds Rate leads durable goods personal consumption expenditures.
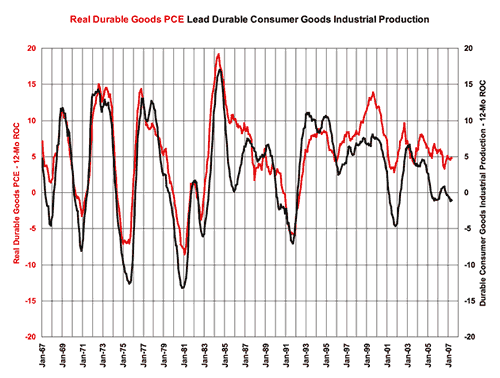
Fig. 2—Durable goods personal consumption expenditures (PCE) lead durable consumer goods industrial production.
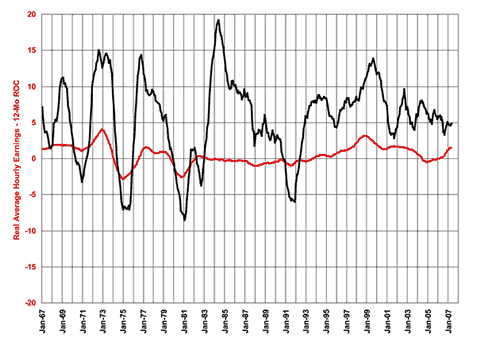
Fig. 3—Real average hourly earnings lead durable goods personal consumption expenditures.
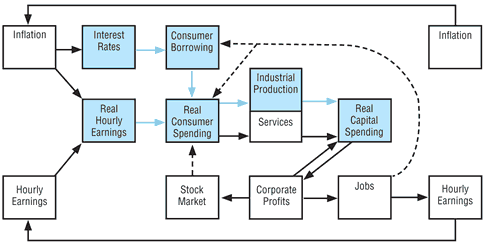
Fig. 1—The economic cycle consists of one variable affecting related variables in sequence. To forecast the future of one variable, look at the current trends of the variables that influence it.

No one knows what the future has in store, but the future has a way of becoming the past. In manufacturing, certain cycles have repeated themselves with enough consistency that we can forecast the future with a certain measure of confidence. In fact, forecasting future business conditions for durable goods manufacturers within ±10 percent is quite realistic.
I perform this kind of analysis for Gardner Publications, the company that publishes this magazine. One of the tools I use is the Metalworking Business Index, but other data come from various economic measures that describe the U.S. economy. The key to looking at these data in a useful way is to use rate-of-change curves.


Rate Of Change
Rate-of-change curves reveal relationships between sets of data that the raw graphs of these data would conceal. To calculate the data points for a 12-month rate-of-change curve, one simply computes the percentage difference between the total of the most recent 12 months’ data and the total of the same 12-month period one year earlier. The percentages are calculated month after month, with the 12-month histories shifting one month each time. This is similar to what most companies routinely do every year—reporting that 2006 sales were 5 percent ahead of 2005 sales, for example—except now the data are compared this way at the end of every month on a rolling 12-month basis. Examples of such rate-of-change curves appear in this article.
When looking at a rate-of-change curve, it’s important to remember that anything above zero indicates growth, and anything below zero indicates contraction. The further we move away from zero, the faster the growth or contraction. Using this method makes it easy to correlate different sets of data and to see the time lag between changes in the two sets of data.
One Thing Leads To Another
Figure 1, on the opening page of this article, shows a diagram of the key economic variables in the U.S. economy. This diagram maps the economic cycle in our country. The diagram’s progression starts on the left, moves to the right, and circles back around to the left side again for the start of a new economic cycle. A solid arrow indicates that one box is a primary driver of the box it points to. A dotted arrow indicates that the box is a secondary driver of the one it points to. To forecast where your business is headed, we focus on the highlighted boxes.
Industrial production—either production of durable goods as a whole or production within some specific end market such as farm equipment—can be used as a proxy for the state of your business. Industrial production is a measure of the volume of goods produced. In general, producing more volume equates to higher profitability.
Close As Figure 1 indicates, we need to know where consumer spending is headed to forecast the direction of industrial production. Consumer spending is the most critical piece of economic data in the United States because it makes up 60 to 70 percent of our gross domestic product. On average—see the rate-of-change comparison in Figure 2—consumer spending leads industrial production by zero to six months. The lead time is often less than three months.
That’s not much time. Capital equipment purchases and other business decisions may require you to look much further than that into the future. Therefore, to forecast consumer spending, we look at the inputs affecting this—real average hourly earnings and interest rates.
“Real average hourly earnings” is a measure of the hourly rate that production workers earn. In the U.S., most people spend almost all of their income. So, rising or falling real average hourly earnings corresponds to rising or falling consumer spending. The lag time between these two variables is six to 12 months, per Figure 3.
In addition, interest rates—Figure 4—are a good indicator of what consumers will spend on durable goods because durable goods are relatively expensive items that many people buy on credit. On average, changes in interest rates lead changes in consumer spending by 18 to 24 months. If we add this time to the time lag between consumer spending and industrial production, we see that interest rates lead industrial production by 18 to 30 months.
With this kind of advance notice and understanding of where the economy is headed, you can make better decisions concerning the right time to add staff, expand your facility or purchase new equipment—or when to cut back.
Getting Specific
There’s more. Instead of focusing this analysis on durable goods in general, a more specific projection can look at the specific end markets you serve. All it takes is some thinking about what statistics might be available that relate to production in a particular end market. (We’ve done a lot of this work for you—see “Learn More”.)
Let’s take the aerospace industry, for example. The purchase of new airplanes or parts for maintenance is probably driven by the number of people flying. As it happens, the government tracks data on “system revenue passenger miles.” This is calculated by multiplying the number of people on a plane by the number of miles the plane flies. Rate-of-change curves (not shown here) show that changes in system revenue passenger miles do lead changes in aerospace industrial production. But how do we know where system revenue passenger miles are headed? Well, people tend to fly more when their incomes are rising. So, using rate-of-change curves, we can correlate the changes in real personal income to the changes in system revenue passenger miles. In this way, following the trends in data for real personal income can signal to a machine shop serving the aircraft industry whether it should prepare to take on more business in the near future.
About the author:
Steve Kline Jr. is Gardner Publications’ financial analyst. Contact him at skline2@gardnerweb.com.


Related Content

Solve Worker Shortages With ACE Workforce Development
The America’s Cutting Edge (ACE) program is addressing the current shortage in trained and available workers by offering no-cost online and in-person training opportunities in CNC machining and metrology.
Read More
All-Around Mill Improves Productivity and Cost for Valve Job
Adopting a mill with a double-negative rake and pockets compatible with multiple insert geometries enabled Progressive Metal Service to increase feed and lower scrap rates for a valve.
Read More
If the Federal Government Is to Solve the Manufacturing Labor Shortage, it Needs to Start Here
Student-run businesses focused on technical training for the trades are taking root across the U.S. Can we — should we — leverage their regional successes into a nationwide platform?
Read More
8 Ways to Increase Productivity on the Manufacturing Floor
When it comes to machine shop productivity, continuous improvement depends on efficient employees, equipment and processes.
Read MoreRead Next

3 Mistakes That Cause CNC Programs to Fail
Despite enhancements to manufacturing technology, there are still issues today that can cause programs to fail. These failures can cause lost time, scrapped parts, damaged machines and even injured operators.
Read More

The Cut Scene: The Finer Details of Large-Format Machining
Small details and features can have an outsized impact on large parts, such as Barbco’s collapsible utility drill head.
Read More