Since the financial collapse in late 2008, manufacturing has been a leader in the U.S. economic recovery. Capacity utilization in metalworking facilities is at a high level and has grown at a historically unprecedented rate for the past three years. Similarly, industrial production has rebounded dramatically from its collapse in 2009. Production of consumer durable goods is growing at its fastest rate in nearly 20 years. The significant turnaround has led metalworking facilities to dramatically increase their levels of equipment and tooling investment.
Gardner Business Media tracks these investment levels for our annual Capital Spending Survey and Tooling & Workholding Survey. Every year (in late July and early August), Gardner surveys readers of Modern Machine Shop and its sister publication Automotive Design & Production about their spending plans for capital equipment, workholding and tooling for the upcoming year. Based on the responses, Gardner forecasts spending on specific machine types, workholding processes and tooling types, organizing the responses by industry segment, plant sizes and regions of the country.
Although the information primarily benefits equipment sellers, the same findings potentially also offer insights useful to you, the equipment user and buyer. Understanding the type of machines, workholding and tooling that the plants in your industry are buying can give you clues about the types of processes your competitors are using to make parts more productively. Also, knowledge of spending trends can help you understand where you might or might not have leverage on pricing. Based on our survey findings this year, what follows is the picture we see.
Drivers of the Manufacturing Recovery
Typically, the metalworking industry lags the rest of the economy. However, since the financial collapse, the metalworking industry and manufacturing in general have been leading the U.S. economic recovery. This unusual circumstance is primarily the result of reshoring—the return of manufacturing production to America after it had been offshored during the last decade.
There are many reasons for the reshoring activity, including high shipping costs, supply chain logistics, poor quality, rising labor costs overseas and lower energy costs in the U.S. Also, there is a general trend toward manufacturing products in the markets where they will be sold.
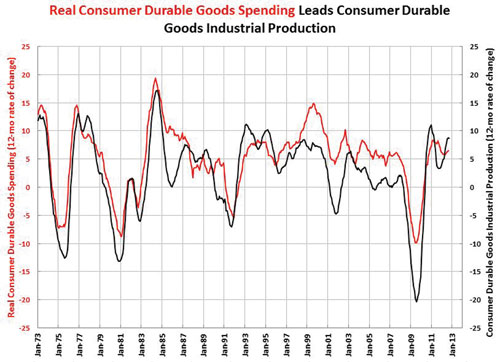
Yet reshoring is not reason enough on its own for the significant rebound in the metalworking industry. Another factor is spending on durable goods, the most important leading indicator for metalworking. Spending on consumer durable goods is now at an all-time high, well above the previous peak levels seen in 2008, and it has been growing at an above-average rate. Chart 1 compares the annual rate of change (how fast the data is growing or contracting year over year) in consumer durable goods spending to consumer durable goods industrial production. The chart shows that consumer durable goods spending leads consumer durable goods industrial production by 0 to 6 months. The strong rate of spending growth during the last two years has resulted in an exceptionally strong rate of growth in industrial production. Industrial production is growing at an annual rate of 8.7 percent, the fastest rate since the mid-1990s. And, with consumer durable goods spending set to grow even faster, industrial production should see strong growth throughout 2013.
Together, reshoring and significantly higher spending on durable goods have increased the capacity utilization at metalworking facilities substantially. In 2009, capacity utilization had fallen to 61 percent. Gardner’s Capital Spending Survey suggests that current capacity utilization is just over 80 percent. In a normal three-year period, capacity utilization would increase five to seven percentage points. The almost 20-percentage-point increase in capacity utilization is historically unprecedented.
Spending Continues to Increase
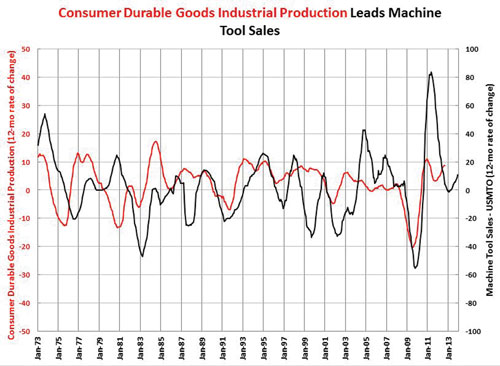
For spending on machine tools, capacity utilization and industrial production happen to be the best leading indicators. Chart 2 illustrates this, comparing the rate of change in consumer durable goods industrial production to machine tool unit sales. The chart shows that industrial production leads machine tool sales by 12 to 18 months on average. The rapidly accelerating growth in consumer durable goods industrial production during the past 10 months indicates that machine tool sales should see accelerating growth in 2013. Our forecast is for unit sales to increase by nearly 11 percent in 2013.
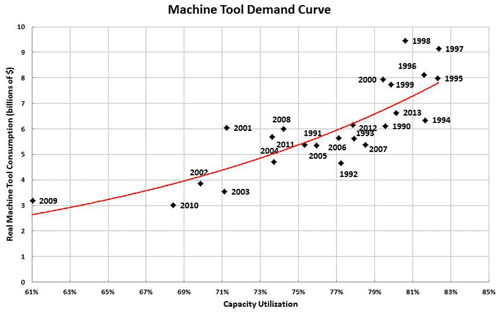
Capacity utilization’s correlation to machine tool sales is shown in Chart 3. With capacity utilization at 80 percent, we expect machine tool sales to be $6.6 billion. The red line on the chart represents the optimal machine tool demand for any capacity utilization. Right away, we can see that machine tool sales are rarely at the optimal level. This is because a metalworking facility cannot buy a fraction of a machine. Also, shops tend to buy more capacity than they need and then grow their way into that capacity. So, metalworking facilities always are either overbuying or underbuying the market. On this chart, points that fall above the optimal line represent overbuying by metalworking facilities and those that fall below the line represent underbuying. Careful study of the chart shows that points tend to group above or below the line in three- to five-year increments.
Machine tool sales for 2011 and 2012 on this chart are estimates, and these estimates are likely to be high. This is because it would be very unlikely for a single year (for example, 2010) to be below the line if both the preceding and following years are above it (or vice versa). If actual sales for 2011 and 2012 fall below the line, then there will have been three straight years (with a potential fourth in 2013) of underbuying in machine tools. This means that in or around 2014 to 2018, there should be a period in which machine tool purchases exceed optimal demand.
When machine tool sales grow at a faster rate, prices tend to rise because demand is strong relative to supply. The same is true in periods of overbuying. However, the general trend of rising machine tool prices could be counteracted by stronger competition among machine tool builders in the U.S. market in 2013. Given that the rest of the world’s manufacturing economies are slowing down, some rather rapidly, and that the United States is one of the world’s fastest growing machine tool markets, machine tool builders will put more emphasis on generating sales in the U.S. This should create more competition in the United States and generally keep machine tool prices lower. The direction of prices will depend on which of these forces wins.
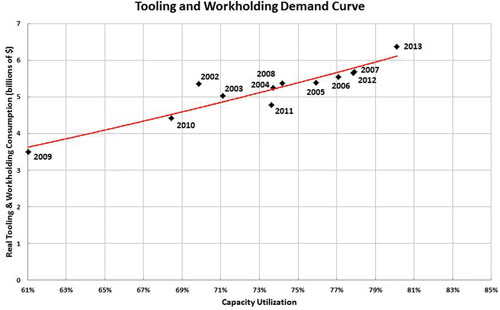
A similar demand chart can be created for tooling and workholding spending. Chart 4 shows this. Once again, the red line represents optimal demand. Unlike machine tool spending, the relationship between tooling and workholding spending and capacity utilization is virtually linear. Also, tooling and workholding spending in any given year falls much closer to optimal demand. This makes forecasting spending on tooling and workholding easier. Our forecast for 2013 U.S. tooling and workholding spending is $6.3 billion.
General Spending Trends
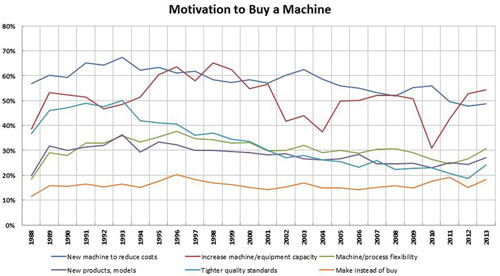
Each year, Capital Spending Survey respondents are asked why they are buying equipment.
Chart 5 shows the responses to that question. Every year, the top two reasons why companies buy machine tools are to reduce costs or increase capacity. Which of these reasons is on top in any given year depends on the state of the industry. In good business conditions, metalworking facilities justify their equipment purchases on a need to increase capacity while in bad business conditions they justify their purchases on a need to reduce costs.
The chart is interesting this year because of the bottom four lines. In the 2013 survey, each of these four lines either moved up sharply or continued an upward trend that began three to four years ago. The most notable of these lines is the one that represents buying a machine to increase process flexibility. This motivation for buying a machine has increased substantially during the last two years. One reason for this is that metalworking facilities are turning toward machines that are more flexible and more easily automated to counteract the difficulty in finding skilled labor. Another reason is that the high capacity utilization levels have led OEMs to outsource more work to job shops. As a result, these shops need more flexible means to process a greater variety of work.
Another general trend in this year’s survey is that spending on horizontal machining centers will grow faster than vertical machining centers in 2013. One reason for this is that HMCs are more flexible and easier to automate, attributes that machine tool buyers are likely to seek out in 2013. A second reason is that general business conditions are better. Metalworking companies with more profits are more willing to spend money on more expensive machines.
A final general spending trend in this year’s survey is that small facilities plan to spend significantly more money. For the first time since at least 2008, metalworking facilities with 19 or fewer employees plan to spend more than $1 billion. This is a substantial increase compared to what facilities of this size spent in 2009 and 2010.
End Market Spending Trends
Since 2009, capacity utilization at job shops of all sizes has improved from the low 60s to the upper 70s. This is helping fuel a major increase in job shops’ spending. Compared to 2009 and 2010, job shop machine tool spending will nearly double in 2013. Spending on tooling and workholding has improved significantly as well. General machine shops will make up more than 80 percent of the spending by job shops. Industrial mold shops will spend almost 100 percent more than in any year since at least 2008, which indicates that these shops have seen their workloads increase dramatically. Almost 20 percent of job shop spending will be on horizontal machining centers with 400- to 800-mm pallets. Also, job shops will spend notably more on CNC screw machines and horizontal CNC lathes with chucks smaller than 10 inches. Significant spending increases in flexible fixturing speaks to the need for more flexibility.
The automotive industry has come roaring back. Capacity utilization fell below 45 percent in 2009 but has since rebounded above 80 percent. Also, industrial production of motor vehicles and parts is growing at by far the fastest rate since at least the mid-1980s. Automotive market segments that are particularly strong include transmission and powertrain parts as well as gasoline engine and engine parts manufacturing. The automotive sector’s 2013 machine tool spending is forecast to be $1.2 billion in 2013, nearly six times our 2010 estimate. Turning equipment will account for nearly 30 percent of that spending. Also, there will be significant increases in transfer and other special-purpose machines as well as gear cutters and cylindrical grinders.
Aerospace industrial production continues to accelerate. Capacity utilization bottomed in 2010 at just over 70 percent. It is now above 80 percent and continues to increase. Airbus’s plans to begin manufacturing in the United States and the amount of unfilled orders at Boeing should keep aerospace industrial production strong for some time. Despite these signs, though, aerospace spending will likely slow, with the exception of one hot segment: guided missiles and space vehicles. This is likely due to drone manufacturing. According to the FAA, there could be 10,000 drones flying over U.S. cities by the end of the decade, suggesting production of drones will increase. Within the aerospace industry, horizontal machining centers will see the largest amount of spending. HMCs with 400- to 800-mm pallets will account for more than 30 percent of the projected spending, while spending on HMCs with pallets smaller than 400 mm will be roughly double that of any year since at least 2008. Also, there will be significant spending on small horizontal turning centers, CNC screw machines and vertical lathes.
About the author: Steven R. Kline, Jr. is the director of market intelligence for Gardner Business Media. As a postscript to this article, he adds: “I would like to thank all of the MMS readers who have participated in Capital Spending or Tooling & Workholding Surveys. Your participation helps make the survey results robust and helps us provide better intelligence on the metalworking market.”

.JPG;width=70;height=70;mode=crop;format=webp)