
U.S. Remains a Big Buyer of Machine Tools
The 2014 World Machine Tool Output and Consumption Survey shows that the U.S. machine tool market has outpaced the rest of the world two of the last three years and is forecasted to grow faster in 2014.
.JPG;width=70;height=70;mode=crop;format=webp)


Click on the graphic above for infographic highlights from the
2014 World Machine Tool Output and Consumption Survey.
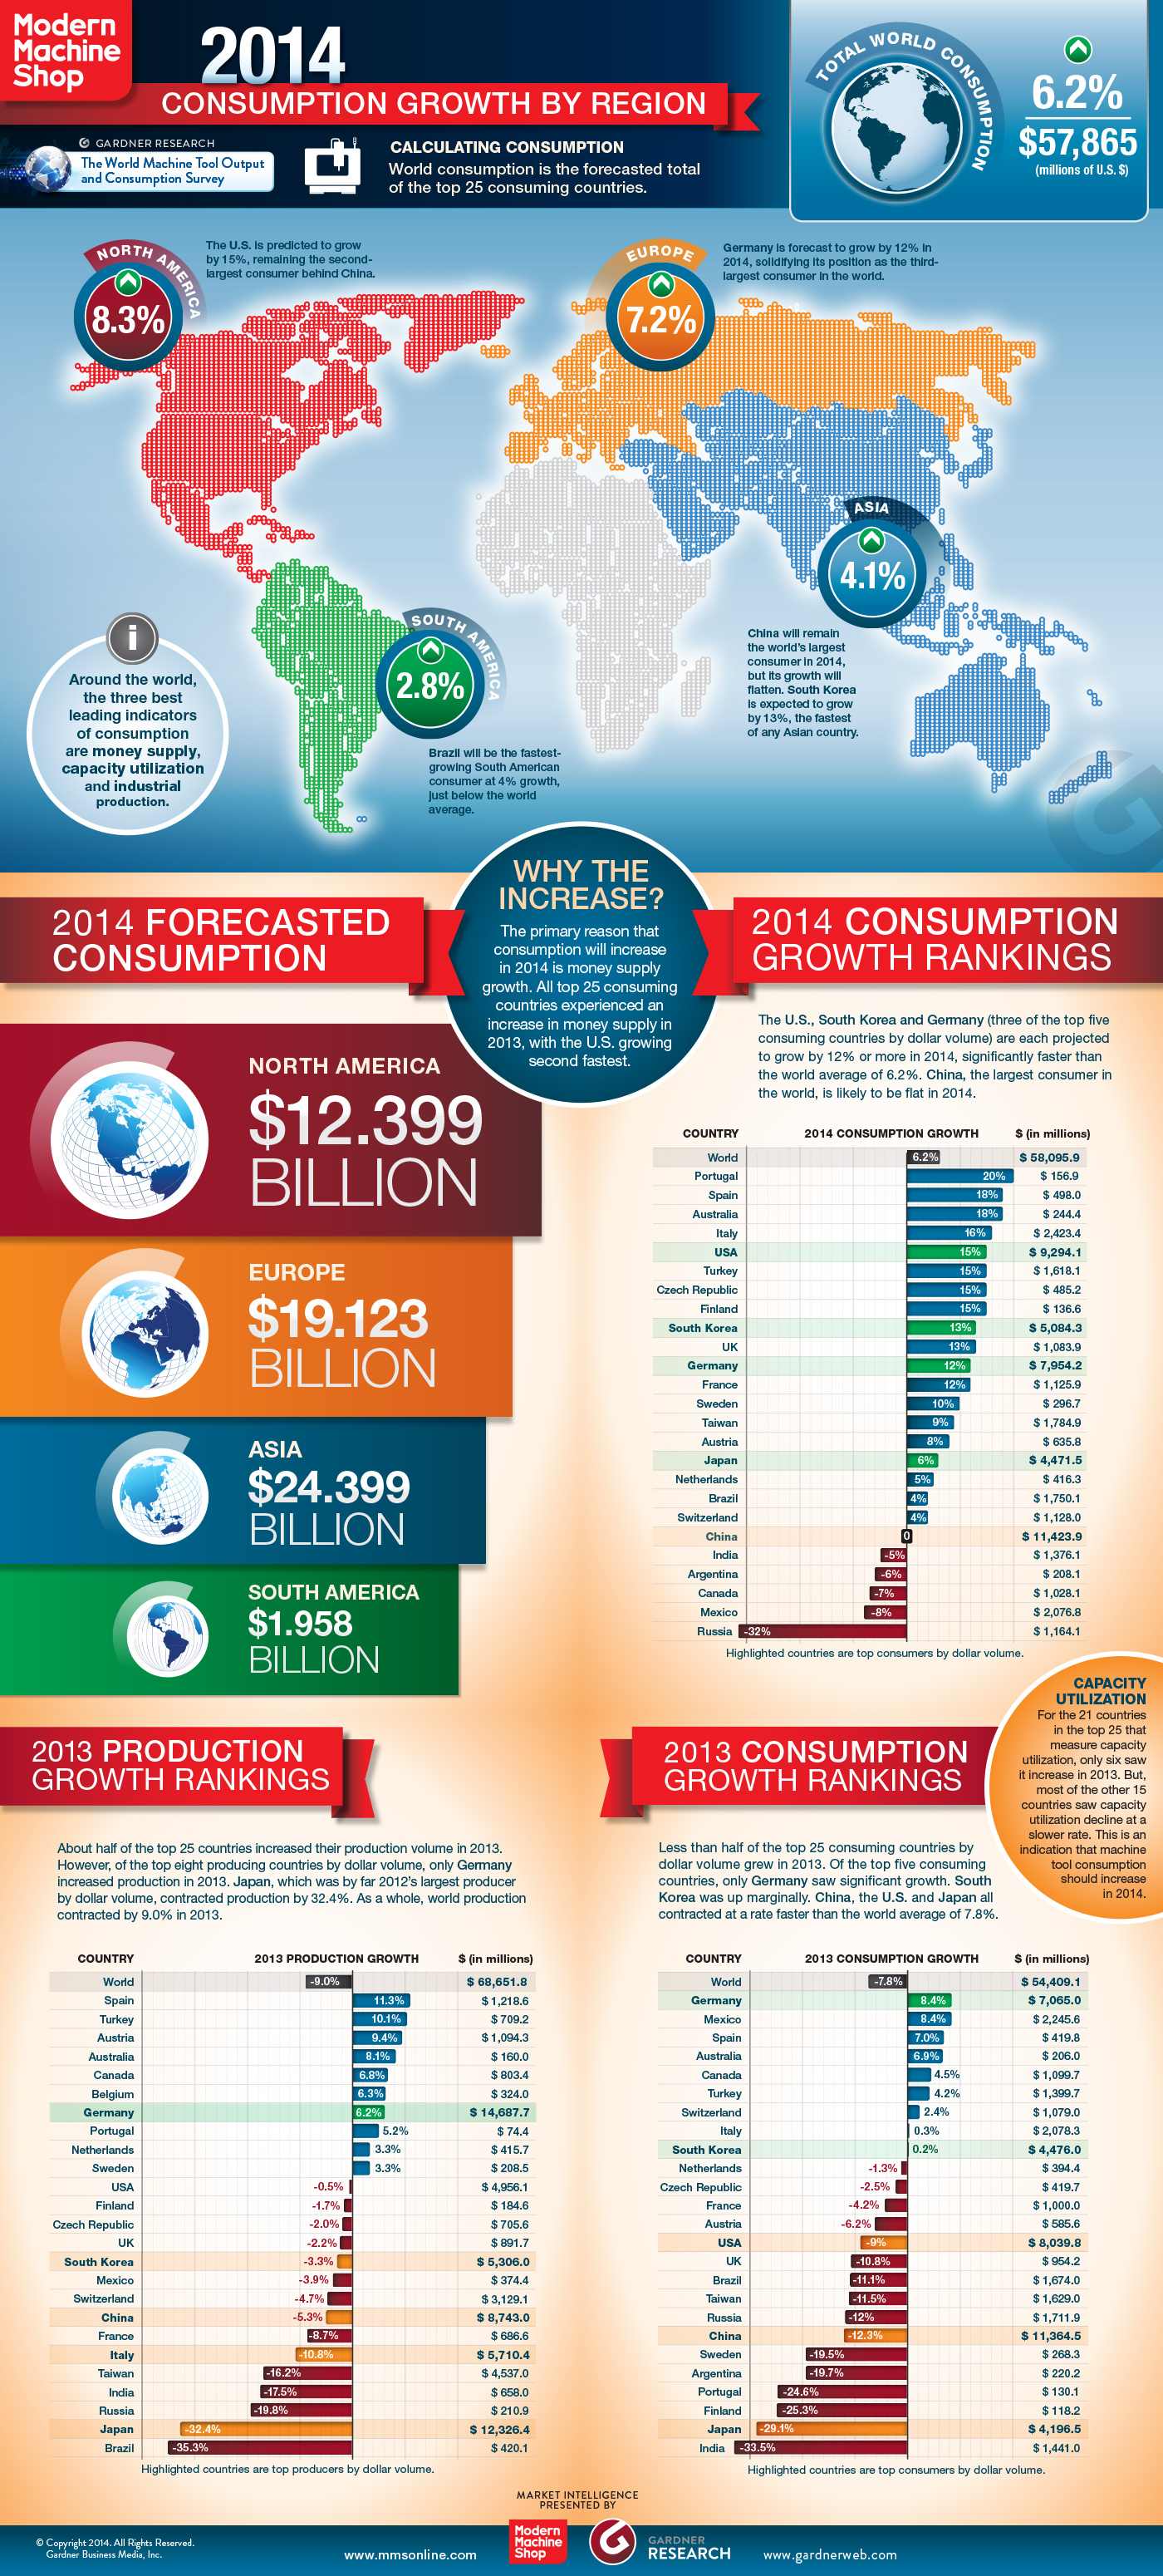
As an indicator of the health of manufacturing in a country, a growing market for machine tools is a positive sign. For this reason, we should be heartened by the prediction that U.S. consumption of machine tools will grow 15 percent in 2014. This level of investment is clear evidence that American manufacturing is undergoing a resurgence.
Let’s start looking at the numbers, as reported in the 2014 World Machine Tool Output and Consumption Survey. Data for this report comes from research conducted by Gardner Business Media, the publisher of this magazine.


In general, there has been a recent turnaround in world machine tool consumption. After growing in 2010 and 2011, world machine tool consumption has contracted for two consecutive years. This rate of contraction in world consumption was slightly faster in 2013 (-7.8 percent) than it was in 2012 (-6.1 percent). However, based on several leading indicators, I am forecasting world machine tool consumption to grow by 6.2 percent in 2014 to about $58,300 million (see Chart 1). When calculating region and world totals, I use the top 25 consuming or producing countries from that year. So, for example, total world consumption in 2002 is from a different set of countries than the total world consumption in 2010. This provides a reasonable approximation because the top 25 consuming or producing countries account for roughly 95 percent of all consumption and production.
This year’s data on production, exports and imports was collected from 27 countries which consume and produce virtually all of the world’s machine tools. Consumption is calculated by adding imports to and subtracting exports from production. The data typically is reported in local currencies then converted to U.S. dollars. After converting to U.S. dollars, all of the data in the 2014 survey also was inflation-adjusted using the Bureau of Labor Statistics’ Producer Price Index for capital equipment to provide a better historical comparison.
For this year’s report, I also made one further adjustment to the data. Unlike the rest of the world, consumption and production in China includes a significant portion of non-CNC machines. Therefore, to provide an apples-to-apples comparison, the consumption and production totals from China have been adjusted for all years to remove the non-CNC part of the machine tool market. The total data for China can still be seen in the “as reported” line of the tables.
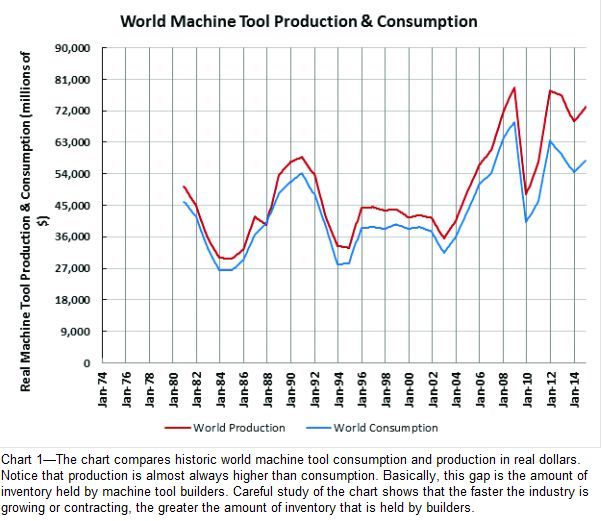
Chart 1—The chart compares historic world machine tool consumption and production in real dollars. Notice that production is almost always higher than consumption. Basically, this gap is the amount of inventory held by machine tool builders. Careful study of the chart shows that the faster the industry is growing or contracting, the greater the amount of inventory that is held by builders.
Leading Indicators Point toward Growth in 2014
The 2014 forecast was created using the three most important leading indicators of machine tool consumption—money supply, capacity utilization and industrial (or manufacturing) production. For most countries, all three of these data points are available; however, for a few countries capacity utilization is not calculated.
Of these three leading indicators, money supply is the most important. No matter the country, the money supply rarely contracts. So, it was no surprise that in 2013 the money supply grew in every one of the top 25 consuming countries. But, in 11 of those countries, the money supply was growing at a double-digit rate. (The U.S. ranked second with a 22.9-percent increase in its money supply in 2013.) Further, in 16 of the countries, the money supply was growing at an accelerating rate. It is this accelerating growth that is indicating stronger machine tool consumption for 2014.
After money supply, capacity utilization is the next most important leading indicator. Twenty-one of the top 25 consuming countries report capacity utilization (excluding China, Russia, Taiwan and India), and it grew in just four of them in 2013. But, in the remaining 17 countries, the rate of change was moving in a direction that indicates growth in machine tool consumption this year.
Industrial production also is an important leading indicator for machine tool consumption, although it has the weakest link to consumption of the three. For 2014, it is providing more of a mixed signal than either money supply or capacity utilization. In 11 of the top 25 consuming countries, production is growing, and in the remaining 14, the rate of change in production is moving in a direction that indicates stronger machine tool sales this year.
World Consumption Highlights
In 2013, the top five consuming countries remained the same, although their order did change some. Despite contracting the last two years, China remains the world’s largest machine tool market. Having grown two of the last three years, the U.S. has narrowed the gap with China but remains the second-largest market. China eclipsed the U.S. as the No. 1 consumer in 2009, and the U.S. lost more to ground in 2010, ending that year just 45.9 percent the size of the Chinese market. Since 2010 though, the U.S. has gained ground on China every year. In 2014, because the U.S. should grow by 15 percent while China remains relatively flat, I estimate that the size of the U.S. market will be 81.4 percent of the Chinese market.
While the top two positions remained unchanged, there was movement among the other three top consumer positions. In last year’s survey, Germany was the fourth-largest consumer of machine tools, but Germany’s consumption grew 8.4 percent in 2013, bumping it up to the position of third-largest consumer of machine tools in the world. I forecast Germany to grow by 12 percent in 2014, retaining its No. 3 position.
Even though its consumption was relatively flat in 2013, South Korea also moved up one spot in this year’s survey to No. 4, and I expect it to grow by 13 percent in 2014.
With both Germany and South Korea moving up one position, Japan fell from third to the fifth-largest machine tool consumer in 2013. This is a further drop from its No. 2 position in 2011. Since then, Japan’s consumption has fallen by almost 45 percent. In 2013, its consumption was less than $5 billion (in real dollars) for just the second time since 2003. This year, however, I expect Japan to grow by 6 percent, or about the world average.
Although it is still not among the top five markets for machine tool consumption, Mexico made the largest jump in the 2013 rankings to No. 6. According to the 2013 survey, Mexico was the 10th largest consumer with $1,361 million in 2012. This year’s survey includes revised data for 2012 and shows that Mexico consumed $2,246 million of machine tools in 2013. My forecast of consumption in Mexico calls for a slight decline of 8 percent to $2,077 million. Yet even with that decline, 2014 would be the third year in a row that Mexico consumed more than $2,000 million of machine tools.
Of all the top 25 consuming countries, India fell the furthest in the 2013 rankings, dropping from sixth to 11th in the world. Consumption in India has fallen from $2,627 million in 2011 to $1,441 million in 2013, or 45 percent, and I think it will continue to contract in 2014, but the rate of contraction will be slower.
World Production Highlights
It is very unusual for the rates of change in production and consumption to be substantially different from each other (see Chart 2). Just like world machine tool consumption, world machine tool production fell for the second year in a row in 2013. The contraction in production was significantly slower than the contraction in consumption in 2012, but it fell at a slightly faster rate than consumption in 2013. In 2012, world production fell by 1.8 percent, and this significantly slower contraction in production resulted in over-production of machine tools in 2012. This in turn caused machine tool prices to fall rather significantly in 2013.
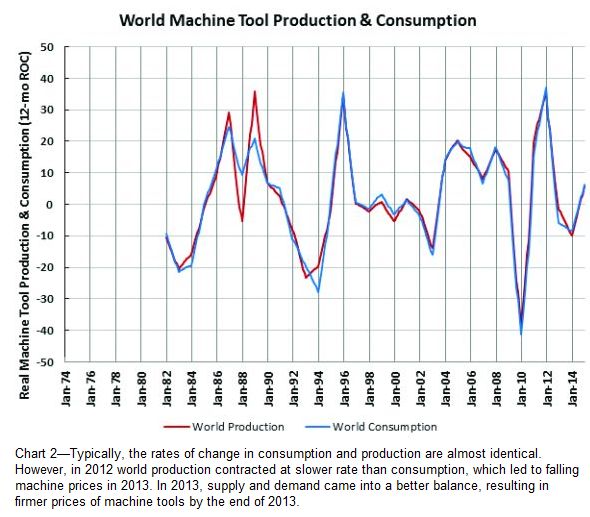
Chart 2—Typically, the rates of change in consumption and production are almost identical. However, in 2012 world production contracted at slower rate than consumption, which led to falling machine prices in 2013. In 2013, supply and demand came into a better balance, resulting in firmer prices of machine tools by the end of 2013.
In 2013, however, supply and demand came into a better balance. Because production fell at a slightly faster rate than consumption last year, by the end of 2013, machine tool prices, at least in the U.S., were improving from what they were a year earlier.
If my machine tool consumption forecast is correct, then builders will need to produce $73,735 million of machine tools for the rate of growth in production to match the rate of growth in consumption, which it has historically done.
While the top five machine tool producers remained the same in 2013 as the year before, only China holds the exact same position in the rankings at No. 3. Its production has contracted at a moderate rate each of the last two years. Germany was once again the world’s largest machine tool producer, returning to the No. 1 spot for the first time since 2009. Production in Germany increased about 5 percent in 2013 from 2012.
Japan fell from the top position, which it had held for the last three years. Production in Japan peaked in 2011 at $18,484 million, but it had fallen all the way to $12,326 million by 2013, a decline of roughly 33 percent.
In 2012, Italy held down the No. 5 spot, but it moved up to the position of fourth-largest producer in the world in 2013. Production in Italy has been relatively unchanged the last three years.
South Korea fell one spot to No. 5 last year. Like Italy, South Korea’s production has been relatively stable the last three years, and for the first time in the country’s history, it has produced more than $5,000 million of machine tools for three consecutive years.
In addition to the consumption and production data, the 2014 World Machine Tool Output and Consumption Survey contains export and import data for each of the 27 reporting countries. You can find the full report with the online version of this article, as well as a link to the forecast and leading indicators for the top 25 consuming countries.


Read Next

Obscure CNC Features That Can Help (or Hurt) You
You cannot begin to take advantage of an available feature if you do not know it exists. Conversely, you will not know how to avoid CNC features that may be detrimental to your process.
Read More
3 Mistakes That Cause CNC Programs to Fail
Despite enhancements to manufacturing technology, there are still issues today that can cause programs to fail. These failures can cause lost time, scrapped parts, damaged machines and even injured operators.
Read More
The Cut Scene: The Finer Details of Large-Format Machining
Small details and features can have an outsized impact on large parts, such as Barbco’s collapsible utility drill head.
Read More