
Questioning Capacity
This chart from Sober Look compares the maximum U.S. manufacturing capacity utilization in the wake of the major recessions of the last 50 years. The chart’s downward trend is striking. After each recession, we peak at less and less capacity use before starting down again.
.jpg;width=70;height=70;mode=crop;format=webp)


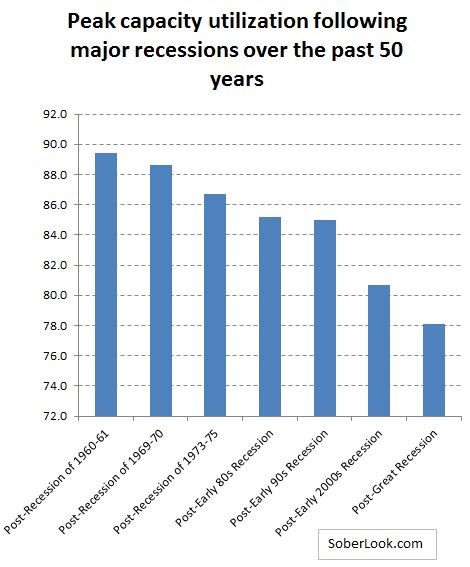
This chart from Sober Look compares the maximum U.S. manufacturing capacity utilization in the wake of the major recessions of the last 50 years. The chart’s downward trend is striking. After each recession, we peak at less and less capacity use before starting down again. Walter Kurtz, the writer posting this chart, sees it as a sign that the U.S. has way too much manufacturing capacity.
I’m not so sure.


Capacity utilization is the percentage of the theoretical total U.S. manufacturing capacity that is currently being put to use. Higher utilization equals higher manufacturing activity. As it’s always been explained to me, the last fraction of that capacity consists of plants’ oldest equipment—that is, the machines that would be allowed to just take up space if they weren’t suddenly needed to fill the strong business demand. Somewhere around 80 percent utilization, I’ve been told, a line is crossed in which new equipment purchases increase, because manufacturers find themselves relying too much on their dated equipment.
However, hasn’t that last fraction of potential capacity become more and more difficult to use over time?
Look at the decline extending to the post-early-90s recession. During this time period, we might expect a plant’s modern machines to be CNC, while its older machines are manual. Shifting jobs from the newer to the older machines therefore would be difficult. A plant in the 1960s could have fired up its 1940s machines when those machines were needed, but a plant in the 1980s probably would not have been able to integrate its 1960s machines into full production as easily.
Then, look at the even sharper decline from the 1990s recession to the current period. Could this be the effect of retirements taking skilled labor out of the market? Shifting work to the older equipment is even more difficult in this case, if there are too few employees possessing the requisite skills to use the old machines.
In short, I am not sure the peak utilization has truly been declining as sharply as this chart suggests. Instead, I think the theoretical total capacity is being overstated by increasing amounts—and this growing overstatement of the denominator accounts for at least part of the trend this chart is picking up. That is, in plenty of cases, machines that do exist and are taking up space in plants should not be counted as capacity, because as a practical matter, the advance of technology and the march of events have proceeded so far since these machines were purchased that they are unlikely to be brought into use no matter what.
(And yes, I still believe that utilization is an unnecessary word.)


