
Total Capital Goods Orders up 16.6% in January
Nominal total capital goods new orders were up 16.6% in January compared to January 2009. (I always compare to the same time period one year ago because economic data tends to be quite seasonal.) This is the first such increase since February 2008.
.JPG;width=70;height=70;mode=crop;format=webp)


Nominal total capital goods new orders were up 16.6% in January compared to January 2009. (I always compare to the same time period one year ago because economic data tends to be quite seasonal.) This is the first such increase since February 2008. Because the inflation factor I use for this data has not been released yet, I don’t include the value of real total capital goods new orders yet. It won’t make much difference in comparing January 2010 to January 2009, however it does make a difference over time and when comparing data using rate of change curves.
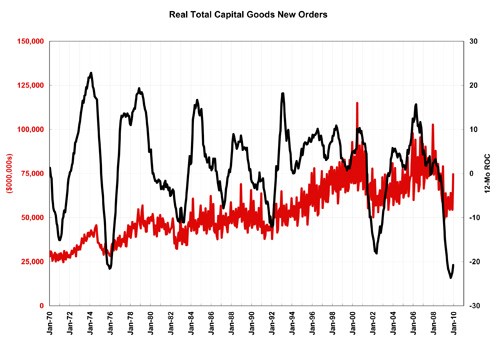
The chart shows real total capital new orders and the 12-month rate of change for these orders. New orders are quite volatile because of the aircraft industry. Real orders in January 2010 will be around $55,000 (in millions). This means new orders for capital goods improved marginally in 2009. The rate of change curve shows that on annual basis new orders are still contracting, but they are contracting more slowly. Real total capital goods new orders are a good leading indicator for durable goods excluding motor vehicle and parts industrial production (essentially capital goods industrial production). You can see how consumer spending, total capital goods new orders, capital goods industrial production correlate here (start with the seventh chart).


