
Zünd Connect Gives Cutting Performance Data at a Glance
Zünd Connect supplies valuable key performance indicators for assessing how efficiently cutting systems are working. The tool consists of multiple dashboards with specific options for evaluating data.


Zünd’s new Zünd Connect monitoring software compiles production data from integrated cutting systems into key performance indicators, such as cutter capacity, availability and overall equipment effectiveness (OEE).
This web-based monitoring tool is said to give the user access to cutter-performance data at a glance. The system records productivity levels over a freely definable period using Zünd Cut Center (ZCC; version 3.4 or later) as a data source.
Zünd says the tool supplies valuable key performance indicators for assessing how efficiently cutting systems are working. Zünd Connect consists of multiple dashboards with specific options for evaluating data.
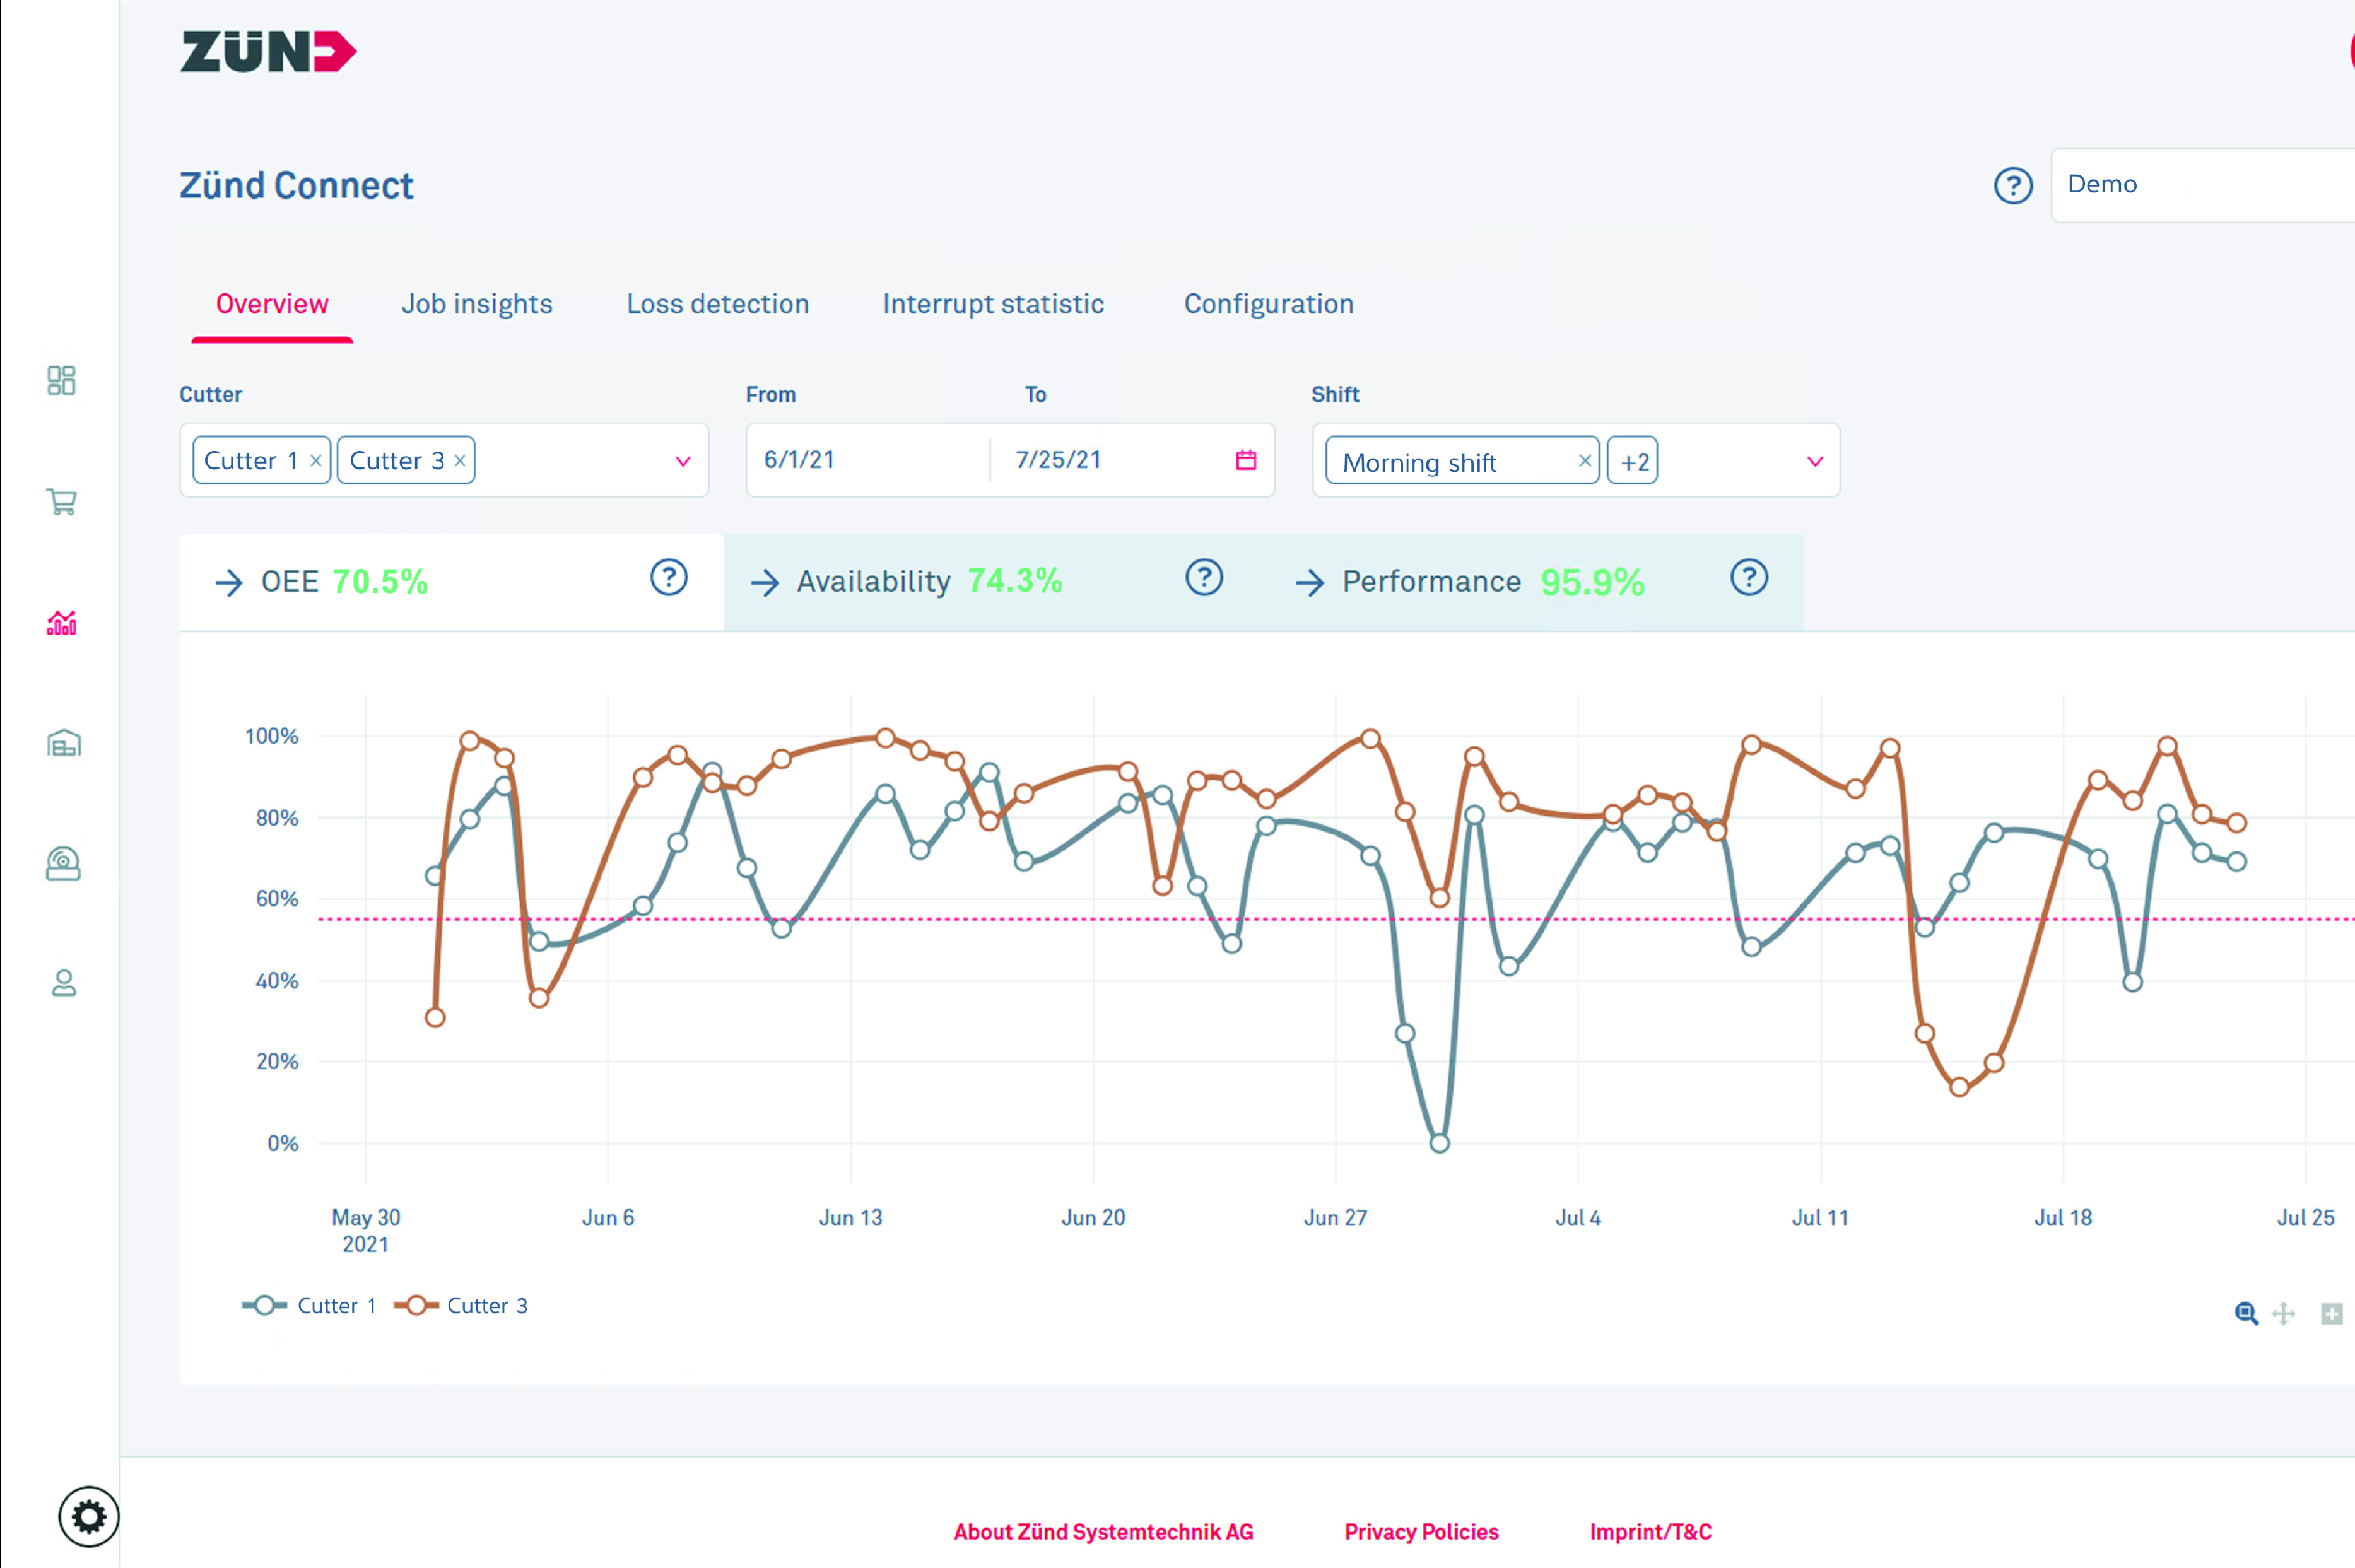
The Overview dashboard provides past production data and indicates, for example, fluctuations in machine utilization. The user can select various views and switch between indices for OEE, availability and capacity. In addition, a filter function can be used to compare performance across different shifts.
The Job List shows a list of processed jobs, what they entailed, the time it took to produce them and the cutting distance traveled per job. Diagrams show the time spent by each individual material/substrate, processing method, tool and module. In reference to materials, for example, bar graphs show the processing time for each material used during a specified time frame.
The Loss Detection view visualizes losses in terms of time. It shows, for example, when process interruptions tend to occur most often. Loss detection enables the user to evaluate factors such as the specific time frames, materials or tools most likely to be associated with interruptions.
The Interruption Statistics view lists the reasons for such interruptions. The user can filter for time of day, material, method, tool or module. The statistical representation shows the user how many hours the cutters were unable to produce during a specified period because of machine interruptions.
Zünd Connect is available in a Monitor or an Analyzer version. Monitor consists of a graphical display of OEE and is available to all ZCC users for free. Analyzer enables subsequent analysis and displays productivity losses, which Zünd says enables the user to evaluate the production process and recommend improvements.
Related Content
-
6 Machine Shop Essentials to Stay Competitive
If you want to streamline production and be competitive in the industry, you will need far more than a standard three-axis CNC mill or two-axis CNC lathe and a few measuring tools.
-
When Handing Down the Family Machine Shop is as Complex as a Swiss-Turned Part
The transition into Swiss-type machining at Deking Screw Products required more than just a shift in production operations. It required a new mindset and a new way of running the family-owned business. Hardest of all, it required that one generation let go, and allow a new one to step in.
-
Becoming a More Efficient Shop With the Right Processes and Software
After refining its machining processes for more efficient production, this shop still needed a better way to track its data. Here's how it found a software solution.


