Back to the Charts for Productive Milling
Roughing operations can push a CNC spindle to its limits. Understanding how to interpret the horsepower chart can keep these operations within safe limits.
Share


There was a time before CNC when a machinist had to rely on a tactile understanding of the power required to accomplish a cut. To feed a tool into a workpiece required jogging the machine table with a crank or pulling the feed handle and plunging by hand. The force required to make a cut was noted by the operator, the feedback loop was internalized and necessary adjustments could be made on the fly.
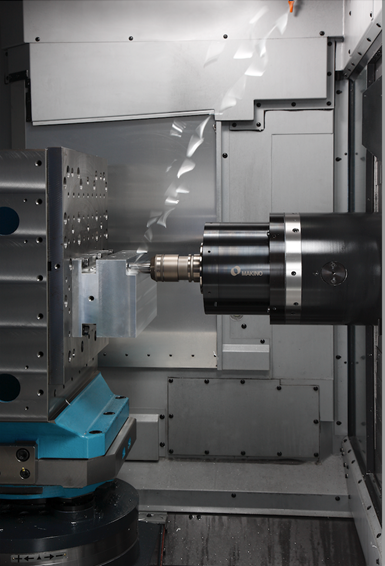
Roughing operations have the greatest opportunity for improving productivity by leveraging the power chart that ships with every CNC machine. Aluminum roughing in process on a Makino a51nx 400mm HMC Photo Credit: Makino
Today, machinists have lost this tangible experience when running CNC machining centers. This observation may give the impression that manual machinists were more in-touch with the trade, but the fact of the matter is that CNC machinists simply lean on a different set of tools to understand the load their machine is facing. In a recent webinar from Makino, product specialist David Ward explained how properly interpreting horsepower and torque charts can help users leverage the full power of their machine tools.


Forming Productive Habits
Many variables affect milling productivity, including speeds and feeds, toolingand the designed capabilities of the CNC machine. An operator must keep these variables at the forefront of their mind when programming a milling operation. However, no two CNC machines are exactly alike. And yet, many CAM programmers will stick to standard feeds and speeds for a cutting tool without regard for the specific power of the spindle they are working with, Ward says. Understanding the relationship between spindle power and speed can help users improve productivity by choosing speeds and feeds that bring the machine closer to the working limits of its horsepower and torque – enabling milling operations to be completed faster than previously realized.
“If the load meter says 115%, you are not abusing your machine, you’re getting your money’s worth.” - David Ward, Makino product specialist
For many operators, consulting the horsepower and torque charts is an exception rather than a habit, Ward says. In part, this is because many CAM systems automate this calculation. Additionally, it is easier to prevent machining problems by programming conservatively. Not to mention that many operators simply rely on their ear when diagnosing the success of an operation. What is left on the proverbial table might be a spindle motor that is running 20-40% under its rated duty cycle — a drastic loss of productivity in some scenarios.
When to Check the Charts
Ultimately, it is not necessary to consult a horsepower chart for every milling operation. Running small operations like tapping, drilling or finishing passes do not require the full capacity of the machine and applying too much power can be detrimental in these operations – resulting in broken tooling or damaged parts. Roughing operations, where large amounts of material are being removed, are the best candidates for improving spindle horsepower utilization.
The most common way to keep an eye on spindle horsepower usage is the load meter. Found on every CNC machine,it provides a real-time display of load that reflects the power usage relative to its continuous duty rating, noted as 100%. These electric motors, which power both direct-drive and belt-drive spindles have a common nomenclature for duty rating. This duty rating determines how long the available power of a motor can be used before the thermal limits are reached.
The International Electrotechnical Commission (IEC) designates eight duty cycle ratings that range from S1 to S8. The low end of the scale, S1, expresses a continuous duty rating. For many CNC machines, this is the power that the machine can maintain indefinitely and is represented on the load meter as 100%. Moving up the scale, S2 is a short-time duty rating. This rating implies that the power is required only for a short amount of time in relation to the total cycle time. For CNC machine tools, the highest end of the duty rating scale is typically S3. This represents the upper threshold of the power chart, and this amount of power can be used for a very short period of time.
In the chart below, the power and spindle speed relationship is plotted along a series of lines. Depending on the manufacturer of CNC machine, just one or all three duty ratings are plotted. It can be observed that as the rpm changes, the power rating of the motor changes. However, parameters like feed rate, depth of cut and material type also determine how fast milling can be performed before a catastrophic failure occurs. So when does it make sense to check the chart? “There is no reason to spend the time calculating horsepower on smaller tools like drills and reamers,” Ward says. “Focus efforts on the larger roughing tools. But even narrowing it down to roughing tools, this is relative to your machine size.”
The reality is that the upper limits of a machines horsepower will be used during rough work when the maximum amount of material is removed at a time for the highest degree of productivity.
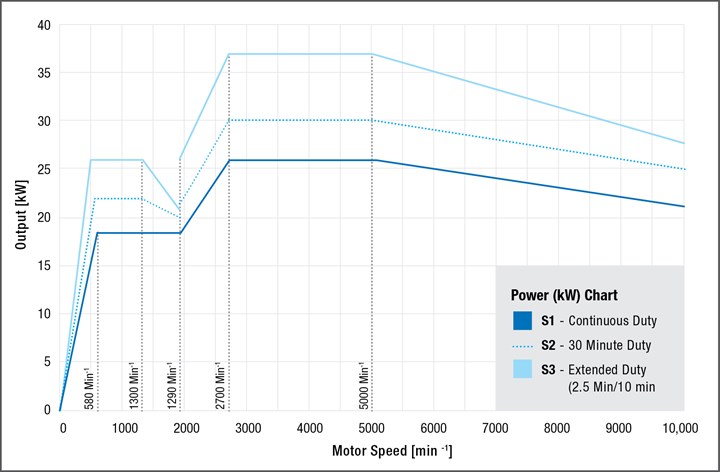
Speed in rpm on the x-axis and power in Kilowatts on the y-axis. Power charts will denote either Horsepower or kW as the the power units. The formula for converting MRR to horsepower and then kW can be found below.
Calculations Behind the Power
When a tool comes in contact with a workpiece, the spindle consumes power as the cutting edge engages with and removes material. The amount of material removed is expressed as the Material Removal Rate (MRR). As the MRR increases, the power usage, measured in kW or HP increases. As detailed in the formulas below, power usage, which is measured in kW or hp, increases along with the material removal rate (MRR). MRR depends on the cutting depth, cutting width and feed rate.
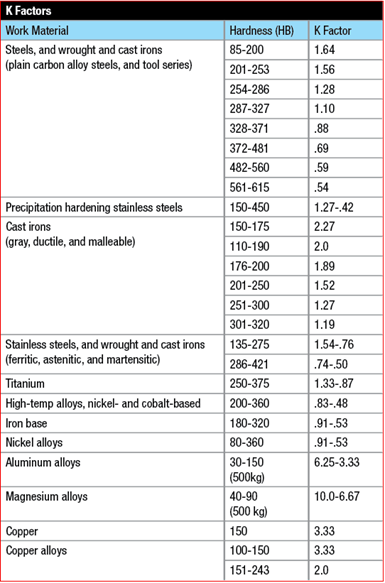
The “K” factor, measured in cubic inches per minute, is the amount of material that can be removed by one horsepower.
Determining horsepower consumption requires the “K” factor: a power constant that represents the number of cubic inches of metal per minute that can be removed by one horsepower. When consulting a chart, “K” factors vary depending on the hardness of the material. K factor data can be found the chart on the right.
Width of cut = Ae
Depth of cut = Ap
Feed rate = Vf
1. Determine MRR = Ae*Ap*Vf
2. Determine HP at cutter = MRR/k
3. Convert to kW= HP * 0.75


Related Content

Okuma Machine Lineup Features Intelligent Manufacturing Technology
IMTS 2024: Okuma’s booth features CNC machine tools, a CNC control, a line of automation systems, intelligent manufacturing technologies, customer services and more.
Read More
Making the Case for Table Changers
Table changers are an often-overlooked automation solution. In the right scenario, they can offer significant productivity gains while keeping your workflow familiar and manageable.
Read More
Hurco Machine-Tending Solutions Support Range of Machining Centers
IMTS 2024: Hurco is demonstrating the capabilities of machine-tending automation through ProCobots-Hurco integration. The company is also showcasing a range of CNC machines.
Read More
DMG MORI HMCs Reduce Energy Consumption
DMG Mori Co. Ltd. introduces the NHX 4000 and NHX 5000 4th Generation, designed for high-speed, sustainable production with reduced cycle times and energy consumption.
Read MoreRead Next

OEM Tour Video: Lean Manufacturing for Measurement and Metrology
How can a facility that requires manual work for some long-standing parts be made more efficient? Join us as we look inside The L. S. Starrett Company’s headquarters in Athol, Massachusetts, and see how this long-established OEM is updating its processes.
Read More