
How to Evaluate Measurement Uncertainty
Manufacturing and measurement are closely coupled. An important consideration for the use of measurement results is the associated measurement uncertainty. This article describes common metrology terms and provides an example uncertainty analysis.


“You can’t improve what you don’t measure” is a quote often attributed to Peter Drucker. In the context of manufacturing, we can interpret this to mean that we cannot increase part accuracy, material removal rate or other key performance metrics if we do not measure the outcomes and relate them to processing conditions. Metrology, or the science and application of measurement, is integral to this measure-and-improve sequence.
Metrology is a manufacturing process in the same way as machining, forging or heat treating because it adds value to manufactured components. It is motivated not only by customer requirements for tolerances and surface finishes, but also by confidence in functionality of assembled components.


Regarding assembly, modern combustion engine automobiles have approximately 15,000 parts and large passenger aircraft have millions of parts. For these complicated assemblies to function properly, the part dimensions must conform to design tolerances, surface finishes must meet design requirements and material properties must adhere to design specifications.
We use various transducers to perform measurements in manufacturing environments. Examples include calipers, micrometers, stylus profilometers, CMMs, structured light scanners, rotary encoders and thermocouples.
For each of these measurements, however, there is always uncertainty associated with the outcome. Therefore, when reporting the measurement result for a physical quantity, it is necessary to indicate the reliability of the measurement. We represent this reliability using measurement uncertainty. To explore uncertainty and other metrology fundamentals, let’s begin with definitions of common terms:
- Accuracy (of a measurement): Accuracy is the closeness of the agreement between the result of a measurement and the (true) value. Accuracy is a qualitative concept, so numbers should not be associated with it.
- Error (of measurement): Error is the result of a measurement minus the (true) value. However, we cannot know the true value because every measurement is uncertain. Therefore, in practice a “conventional true value” is sometimes used.
- Uncertainty (of measurement): Uncertainty is a parameter that characterizes the dispersion of values that could reasonably be attributed to the measurement result. Uncertainty can be characterized using statistical methods, such as the standard deviation.
- Resolution: Resolution is the minimum detectable quantity for a selected transducer.
- Repeatability (of results of a measurement): Repeatability is the closeness of agreement between the results of successive measurements of the same parameter carried out under the same conditions of measurement (same procedure, observer, instrument and location over a short time period).
- Reproducibility (of results of a measurement): Reproducibility is the closeness of agreement between the results of measurements of the same parameter carried out under changed conditions of measurement (for example, a new observer or instrument).
Some common misuses of these terms are:
- precision is substituted for accuracy; precision indicates repeatability
- accuracy is used as a quantitative, rather than a qualitative descriptor
- uncertainty is reported for an instrument.
For the final bullet, measurements have an uncertainty, but instruments do not. If the part size or feature changes in measurements performed on a CMM, for example, the uncertainty may vary. Figure 1 describes how these terms are related.
The measured value is the result we obtain from our transducer. It differs from the true value by the error, but we don’t know the true value, so we don’t know the error.
Therefore, we use the uncertainty interval (gray box) to indicate our belief that the true value of the measurement lies within the specified range with a stated level of confidence. This enables the user of our measurement data to make the best decisions about the quantity that it describes.
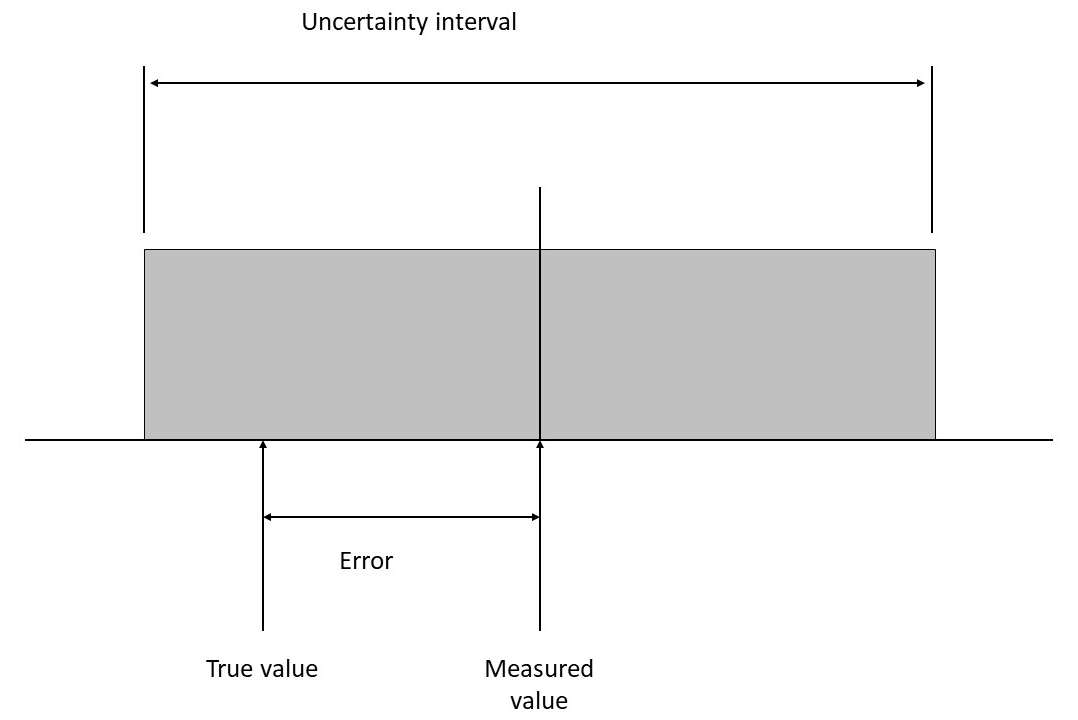
Figure 1: Relationship between measurement terms. Photo Credit: Tony Schmitz
To evaluate the uncertainty of a measurement, we complete an uncertainty analysis. As an example, let’s consider the density measurement for an aluminum block with nominal dimensions of 10 mm × 12 mm × 50 mm.
As shown in Figure 2, we see that the density (r) measurement, which is the mass (m) of the block divided by its volume (V), is composed of four separate measurements: one mass measurement using a digital scale and three length measurements, a, b and c (that are multiplied to obtain the block’s volume), using digital calipers. Because more than one measurement is required, the density measurement uncertainty is evaluated using the combined standard uncertainty (uc).
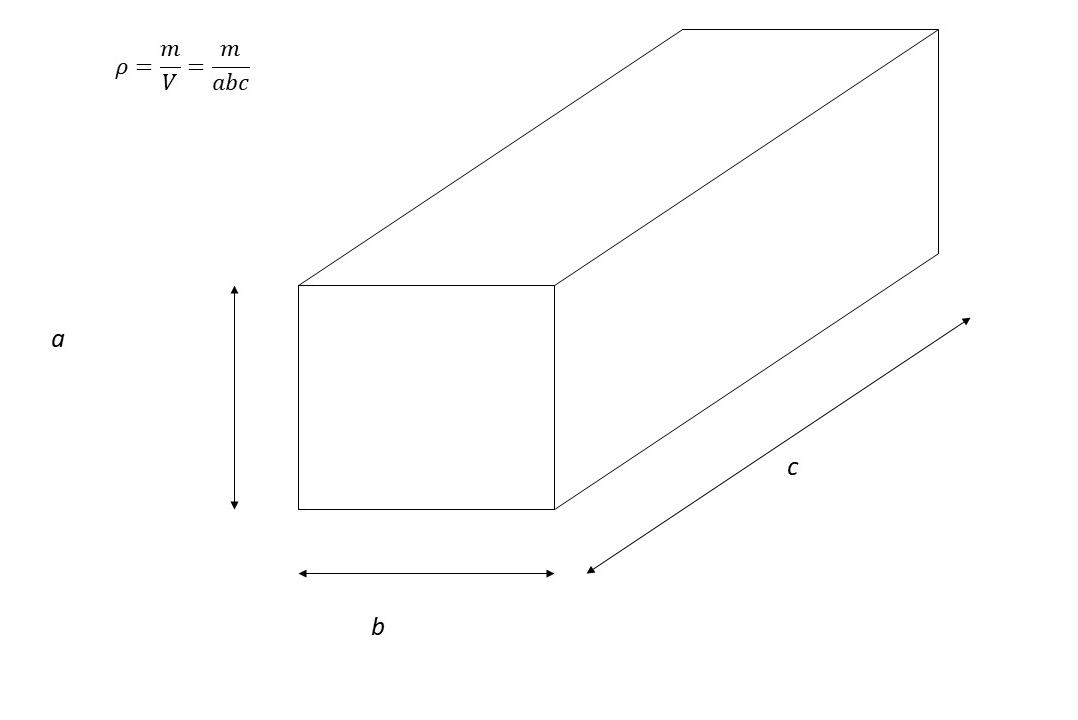
Figure 2: Aluminum block for density measurement. Photo Credit: Tony Schmitz
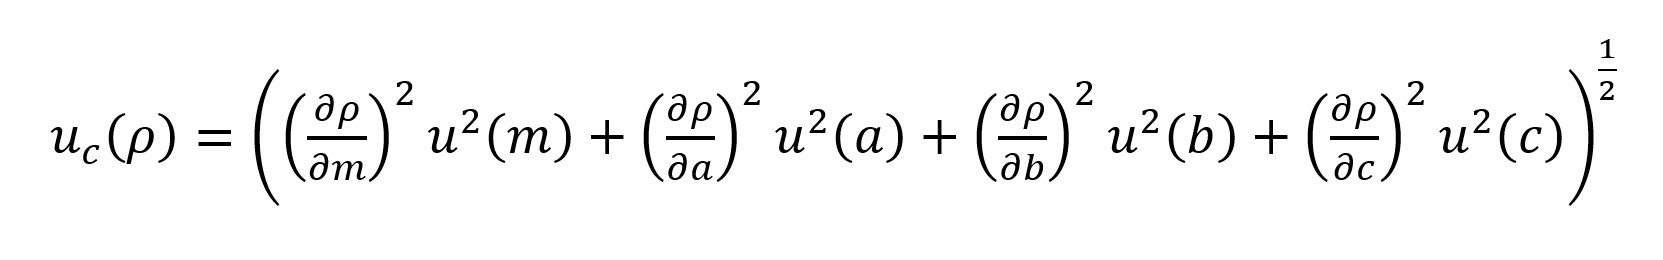
We evaluate the combined standard uncertainty for the density measurement using a scary-looking equation; see Equation 1. While Equation 1 may be daunting (it’s called a partial differential equation), its meaning is not.
We see that there are four similar terms which are added together. Each of these terms contains a ratio which represents the sensitivity of density to a particular measurement. The square of this ratio is multiplied by the square of the uncertainty in that measurement.
After we complete this calculation, the value represents one standard deviation of the expected uncertainty for our density measurement. The larger this number, the wider the gray uncertainty interval in Figure 1.
To complete the example, let’s assume we’re using calipers with a digital readout that reports xx.xxx mm, where the right digit indicates the resolution (0.001 mm in this case). For the selected calipers, the manufacturer stated that the length measurement uncertainty is 0.025 mm. We will assume that this uncertainty can be used for each of the three block length measurements.
For the mass measurement, we’ll select a digital scale with a readout of x.x grams (g). The resolution is then 0.1 g. Without other information about the scale, we’ll use our engineering judgement to specify a measurement uncertainty of 0.3 g (three times the resolution). We generally expect the uncertainty to be greater than the resolution.
We used these two transducers to measure the block and obtained the following values: m = 16.1 g, a = 10.142 mm, b = 12.265 mm and c = 50.127 mm. Substitution in Equation 1 gives Equation 2, where we converted grams to kilograms and millimeters to meters.
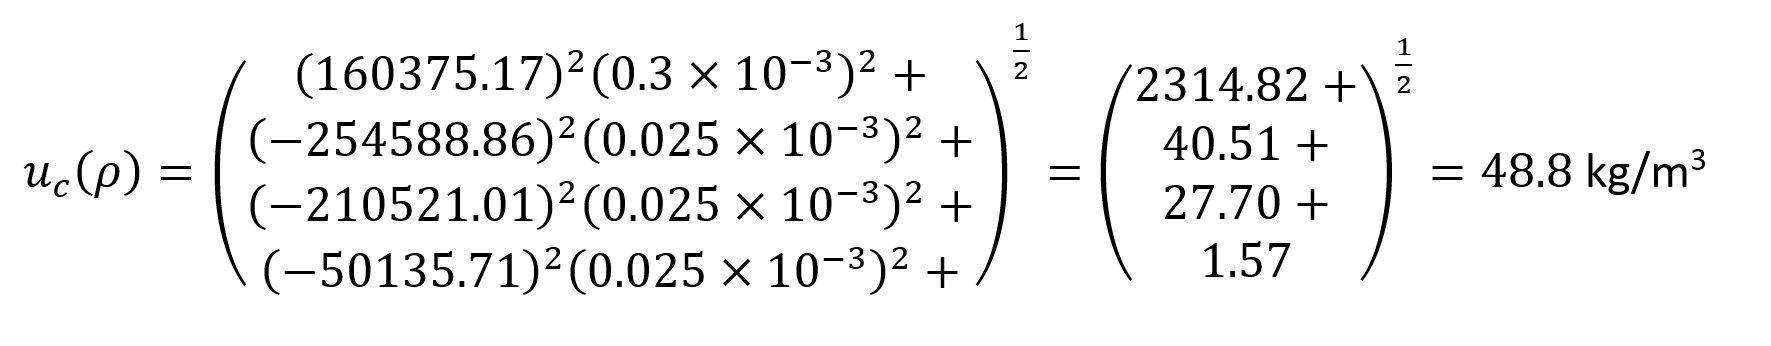
The result of 48.8 kg/m3 represents one standard deviation from the mean value. For a normal distribution (i.e., a bell-shaped distribution), one standard deviation captures about 68% of all potential density values.
If we examine the four terms that are summed in Equation 2, we see that the first term (2314.82) is much larger than the other three. This first value is associated with the mass measurement using the digital scale. This means that if we desire to reduce the density measurement uncertainty, we should focus our attention on the scale. If reduced uncertainty is required, we could consider investing in a digital scale that offers lower uncertainty for our aluminum block mass measurement.
The result of the density measurement is the mean value ± the uncertainty. The mean value is calculated using the four measured values:
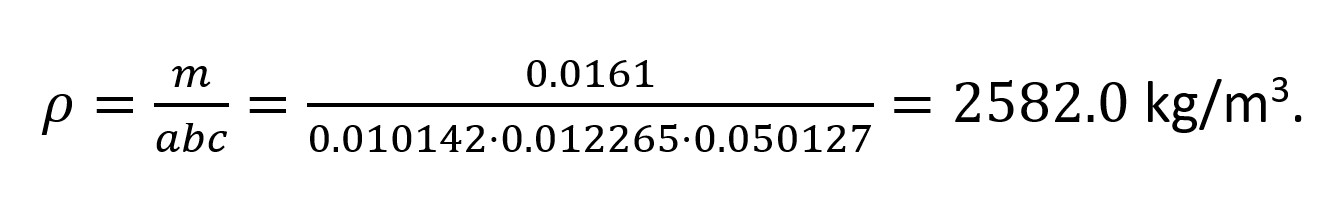
Finally, we express the density measurement result as: 2582.0 ± 48.8 kg/m3. Given this complete measurement description, it is possible to assess whether the block density is acceptable for a particular application.


Related Content

How to Choose the Right Cut Off When Measuring Roughness
Measurement results for surface finishing parameters can vary depending on the filter parameter (Lc), also known as the cutoff.
Read More
A Case for Combining Workholding with Optical Scanning
Automotive dies and die inserts are often complex, one-off parts with little room for error. Integrity Tool's investments in modular workholding tools and 3D optical scanning have allowed the company to create niche capabilities for its CNC machined parts.
Read More
Building an Automation Solution From the Ground Up
IMTS 2022 provides visitors the opportunity to meet with product experts to design automation solutions from scratch.
Read More
How To Calibrate Your Calipers
If you’re interested in calibrating your own digital, dial or Vernier calipers, here are some steps to take to make sure it goes off without a hitch.
Read MoreRead Next

3 Mistakes That Cause CNC Programs to Fail
Despite enhancements to manufacturing technology, there are still issues today that can cause programs to fail. These failures can cause lost time, scrapped parts, damaged machines and even injured operators.
Read More

The Cut Scene: The Finer Details of Large-Format Machining
Small details and features can have an outsized impact on large parts, such as Barbco’s collapsible utility drill head.
Read More