


Share


After more than a decade of collecting and analyzing survey data from CNC machining businesses, we have a solid understanding of what separates “top shops” from others. Year after year, survey responses reveal that the most successful machine shops understand the value of their people, and they invest accordingly. They boldly adopt new technology without losing sight of the importance shopfloor fundamentals and overall business strategy. However, generalized insights about how top-performing shops differ from their peers often leave individual survey participants — and just as importantly, our own researchers — with a critical question: So what?
Why would a producer of large, unwieldy parts want to compare setup times with nearly 300 other shops, few of which are likely to share that specialty? How does setup time (or any other metric) impact profit margins at aerospace shops compared to automotive shops, or at captive shops versus job shops or contract shops? Whatever the specifics, the most important question for a shop owner is not what makes any CNC machining business successful, but what makes a business that looks like my business successful?


Lists of specific metrics identify areas in which the shop over- or underperformed compared to the rest of the group.
Context matters, and the ongoing evolution of the Top Shops program reflects our awareness of this. Changes in how we collect information reflect the maturation that comes with experience and a better understanding of how shops interpret questions. Changes in how we present information reflect our recognition that a tool for driving change is more valuable than a descriptive document. Perhaps most importantly, changes in our own organization reflect our focus on deepening analysis and answering questions about not only how a specific manufacturer compares to its peers, but how specifically it might improve.
By “we” I mean Gardner Business Media (GBM), publisher of Modern Machine Shop. More specifically, I mean Gardner Business Intelligence, a division of GBM dedicated to market intelligence that has benefited from significant investment in recent years. With new tools and new personnel, including survey experts, economists and Ph.D. data scientists, Gardner Intelligence is devoting more time and effort than ever to making Modern Machine Shop’s Top Shops program more valuable, more relevant and easier to leverage for individual participants. The following provides an overview of what has changed as well as what is yet to come in this team’s efforts to make benchmarking data actionable.
A Report or a Tool?
Prior to 2018, everyone received the same report comparing “top shops” (survey respondents ranking in the top 20% of Top Shops scores, which are calculated from an aggregate of secretly weighted metrics) to “other shops” (the other 80% of survey participants). Now, every report is customized. The focus is still top shops versus other shops, but now the information is formatted to reflect how each participant’s individual data compares to others that completed the survey.
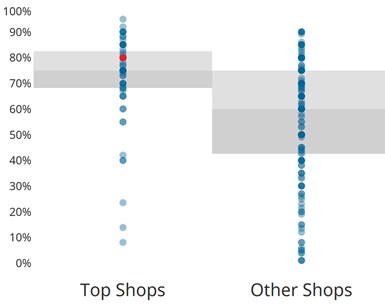
The new format uses dot plots like these to display continuous data — that is, survey answers that are numerical. This example shows spindle utilization.
In fact, a summary of this information is one of the first pages of survey analysis results. At the top of this page is the shop’s overall Top Shops ranking (this year’s program ranks 298 total participants). Then, lists of specific metrics — spindle utilization, labor turnover rate, order lead time and so forth — identify areas in which the shop over- or underperformed compared to the rest of the group.
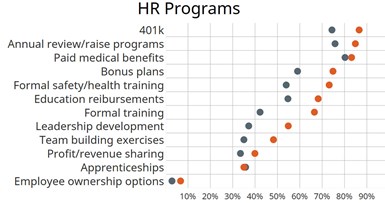
Scatter plots display dichotomous data (that is, answers to yes or no questions). As seen here, there is a fairly sizeable spread between the human resources strategies of Top Shops and other shops.
After the performance summary is a section about how to read the rest of the report, but some might debate the necessity of this instruction. After all, the most immediately obvious shift from past years’ reports is a more visual format. Dot-plots and scatter plots like the ones above make the data easier to digest than previous reports, which listed aggregate responses for each survey question in tables of numbers consisting of three columns (top shops, other shops and all shops). Each graphic is accompanied by an explanation of why the metric in question is important. For example, gross sales per machine can reveal how well a shop uses its equipment, whereas gross sales per employee can reveal how well it prepares people for their jobs.
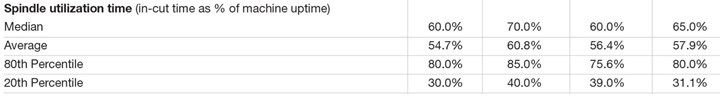
Prior to 2018, Top Shops reports consisted of page after page of tables like this one.
Other formatting changes are less obvious, but no less significant in changing the overall experience of Top Shops. For instance, wherever respondents are prompted to check off items in a list (for example, which materials they machine or which workholding devices they use), the aggregate responses are no longer listed alphabetically. Rather, the most popular responses are listed first. As always, the goal is to put data into context and make it actionable without any extra effort from participants.
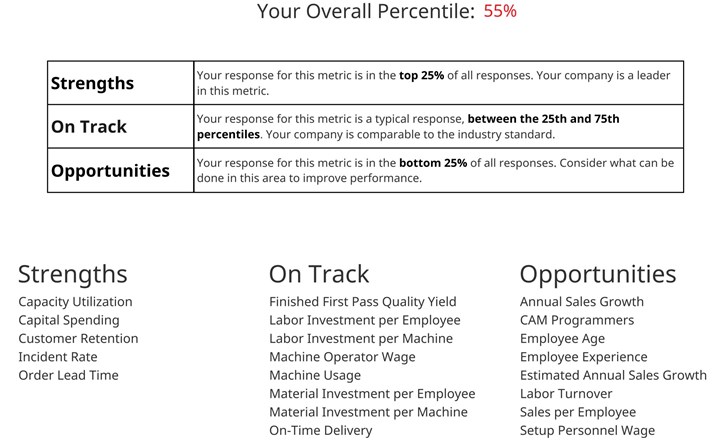
An example of a performance summary from a Top Shops custom report.
More Than a New Look
Behind the scenes, new formatting is less about presentation than organizing the data in a way that makes it easier to find correlations and provide additional, more granular insight. One example is a custom breakout: essentially, a more focused report that compares specific metrics of specific subsets of survey participants. For example, a breakout might compare only shops located in Michigan, Illinois and Indiana.
Custom consulting services from the Gardner Intelligence team are another example of additional insight. A simple example is helping a shop prioritize the improvement opportunities identified in its custom report. Together, these two services provide means for shops to challenge gut assumptions or, in other cases, to back gut assumptions with real-world evidence.
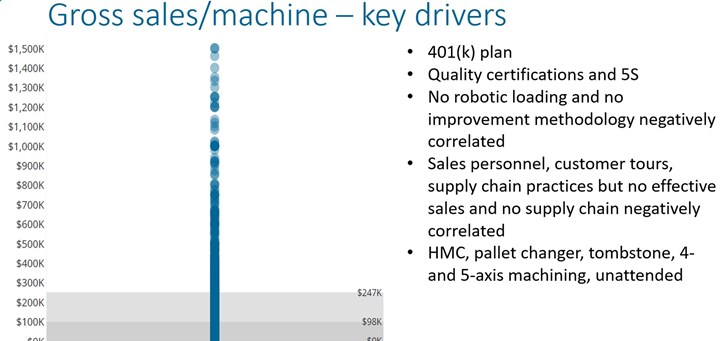
Drivers analyses’ like this one can reveal the practices behind the numbers by examining relationships between metrics. Such analysis is the subject of regular Gardner Intelligence presentations.
A decade’s worth of cumulative data also facilitates drivers’ analysis, which examines relationships between variables. For example, which metrics (quote-to-book ratio, capacity utilization and so forth) have the most impact on the profit margins of shops reporting a high percentage of aerospace industry work? Gardner Intelligence presents these insights through regular web presentations as well as industry events and conferences.
Actionable Without Effort
What’s to come is even more exciting. Current methodologies may be new for Gardner, but they are only a bridge to more advanced capabilities that, as of the time of this writing, we are still working to implement. Eventually, we hope to automate our own processes to the extent that we can include the kinds of data views now provided by custom breakouts in every report.
This will require evolving beyond the “top shops versus other shops” paradigm that has come to define the reports thus far. To be clear, that kind of information will still be a significant focus. However, individual reports will be individualized even further. No longer will all metrics be considered as potential strengths or weaknesses, nor will all participating shops be considered peers. Rather, the analysis will consider only what impacts the profitability of shops that look like the survey-taker’s. In fact, we’ll even be able to prioritize the more specific improvement opportunities identified in the new reports. For instance, one shop might be better served by focusing on spindle uptime before capacity utilization, but the order might be reversed for another.
As for what defines “shops that look like that shop,” we will divide survey responses into four quadrants: low-mix, high-volume shops (that is, manufacturers that machine a small variety of parts in large volumes); high-mix, high-volume shops (this describes some aerospace and medical manufacturers); low-mix, low-volume shops (such as prototyping businesses); and high-mix, low-volume shops (a segment that includes job shops). The decision to organize participants in this way is based on experience, with more than 10 years’ worth of survey data indicating that the metrics driving shop profitability differ markedly in each of these four categories.
It is important to remember that Top Shops is more than just a survey. It is also an event (which, given the pandemic, will look a little different this year). It is the Webinars on key insights that we had already been presenting regularly. It is also a community – a community of shops, of Honors Program winners, and of technology suppliers, distributors and more. It can even be a tool for broader economic development, as indicated by recent interest from various state governments in our data. Finally, Top Shops is articles like this one, which serve to educate the industry about what we are doing and, ideally, spur more North American CNC machining business to act.


Related Content

Machine Shop Mastery: Insights from America’s Top Shops
Ever wonder what sets Top Shops apart from the competition? Dive into their award-winning practices and explore behind-the-scenes strategies for operational excellence.
Read More
The Human Impact of Machining Technology
SSP’s commitment to adopting the latest machining technology benefits not only the business, but its employees as well.
Read More
How to Succeed as a Small Swiss Shop: Top Shops 2025
Can small shops succeed with advanced machine tools and software? If so, how do they do it? Read on to learn the strategies that have helped Midway Swiss Turn, our 2025 Top Shops Honoree in Shopfloor Practices, thrive.
Read More
Increasing Productivity with Digitalization and AI
Job shops are implementing automation and digitalization into workflows to eliminate set up time and increase repeatability in production.
Read MoreRead Next

World Machine Tool Report Shows Manufacturing Shift to North America
After increasing machine tool purchasing for the past two years, 12 of the top 15 machine tool consuming countries decreased in 2019 in the midst of a worldwide downturn. But in a sign of reshoring, the U.S. increased its share overall, and machine tool purchasing by Mexico increased.
Read More
Video: The Meaning of the Gardner Business Index
Learning some background information about what the Gardner Business Index is and why these numbers are important can be beneficial to your company and the way you do business.
Read More
OEM Tour Video: Lean Manufacturing for Measurement and Metrology
How can a facility that requires manual work for some long-standing parts be made more efficient? Join us as we look inside The L. S. Starrett Company’s headquarters in Athol, Massachusetts, and see how this long-established OEM is updating its processes.
Read More