
Pandemic Continues Machine Tool Industry Downturn, but U.S. Now a Top 4 Producer
While the machine tool market continues to fall globally, the fact that production exceeds consumption suggests that machine availability will be high as the world economy recovers. But signs also indicate that China’s increasingly diversified export market is a strategy to expand its influence over developing nations.
.JPG;width=70;height=70;mode=crop;format=webp)
Share


The World Machine Tool Survey contains not only import and export data on high-level machine types, but also consumption and production data as well as data related to the top 62 machine tool consuming countries. Photo Credit: Getty Images
In what will be a surprise to one, the coronavirus and resulting economic lockdowns in numerous countries around the world had a significant impact on the machine tool market. This comes through clearly in the findings of our latest World Machine Tool Survey, which Gardner Intelligence conducts annually to quantify country-by-country machine tool output and consumption. According to the latest survey, machine tool consumption last year was down one-fifth from what it was in 2019. The 2008-2009 financial crisis also significantly affected the global machine tool market and serves as an interesting comparison to what took place in 2020 (more about that in a bit).
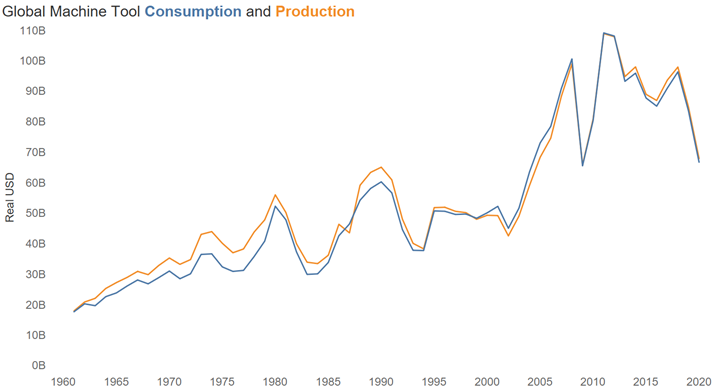
Production was down, too, but there were slightly more (about 2%) machine tools produced than consumed in 2020. The good news is that machines should therefore be available as the world economy opens back up. The bad news is that access to these machines may be hindered by severe global supply chain disruptions. And inventoried machines may not be the type buyers want.


In 2020, China’s machine tool consumption also exceeded its production, but by the smallest amount since 1999, which was before the trend of offshoring American manufacturing really got going. What the changes in China mean is worth understanding.
Machine tool consumption was down in 2020, though less than expected. China’s machine tool consumption exceeded its production by the smallest amount since 1999. Photo Credit: Gardner Intelligence
Consumption Lowest Since 2009
Given the very cyclical nature of the machine tool industry, last year’s report mentioned that the strong market in 2018 was a sign that 2019 would suffer a significant downturn, which it did. Of course, 2020 continued that downturn.
Global machine tool consumption in 2020 was $66.8 billion, down $16.8 billion, or 20.1%, from 2019. This was the lowest level of consumption since 2009, when consumption was just $1.2 billion less than in 2020. However, it took two years for consumption to fall to its current level. In 2009, machine tool consumption contracted 34.8%, or $35 billion, which is more than twice the decline of 2020. From that perspective — and somewhat surprisingly — the effects of the economic lockdowns on the global machine tool market are not as severe as could have been expected.
However, these effects are consistent with a larger trend. Our survey has shown global machine tool consumption to have been in a downtrend since 2011, falling more than $46 billion since it’s all time high in 2011. This is the longest and largest contraction in the history of the machine tool industry.
Going deeper on the 2020 numbers, and what did and did not change:
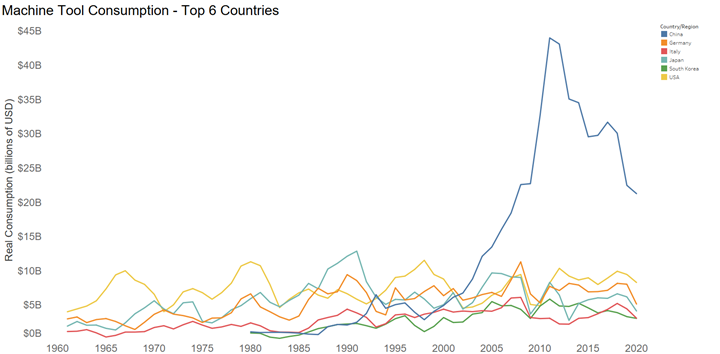
The top seven consumers remained unchanged in their world ranking in 2020. All but two, China and South Korea, contracted more than 10%. The number of countries that consumed more than $1 billion decreased to 14 in 2020 from 16 in 2019. Forty six of the 62 countries in the report (we added Nigeria and Uzbekistan per our rule of including any country with a single year of more than $100 million in imports) were down double digits in 2020. Yet there were four countries that managed to increase machine tool consumption in 2020: Morocco (33%), Indonesia (26%), Finland (19%), and Turkey (18%). Turkey and Indonesia have fairly sizable machine tool markets.
Top 5 Consumers of Machine Tools
| Rank | Country/Region | 2019 | 2020 | %Change |
|---|---|---|---|---|
| 1 | China | $22,518,079,312 | $21,310,000,000 | -5% |
| 2 | United States | $9,509,577,372 | $8,339,160,000 | -12% |
| 3 | Germany | $8,087,188,144 | $5,190,400,000 | -36% |
| 4 | Japan | $6,239,751,996 | $4,175,672,000 | -33% |
| 5 | Italy | $4,487,893,896 | $3,128,127,044 | -30% |
Production Exceeds Consumption
In 2020, global machine tool production was $68.0 billion, down $16.9 billion from 2019. This was about $2 billion more than total production in 2009. Although, like consumption, it took production two years to fall to its current level when it only took one year during the financial crisis. In 2020, production exceeded consumption by 2%, which is a similar amount compared to the previous seven years. While production exceeded consumption every year since 2009, the trend in the increase in the production to consumption ratio began in 2005 after the ratio of production to consumption bottomed in 2004 at 0.93.
While the good news is that this high level of production should mean machines will be readily available as the world economy recovers, it also means that machine tool builders may not be able to increase prices as much as in a normal recovery. However, the severe global supply chain disruption in the shipping industry may limit the availability of machine tools and push prices higher.
The top eight producers of machine tools remained unchanged, although the U.S. switched places with Italy, moving up to number three from number four. All but one of the top 15 producers contracted. The exception was Russia, which increased production just 1%. Four other countries increased their production: Slovenia (28%), Philippines (23%), Finland (16%), and Bulgaria (7%), although these four countries account for a very small portion of global machine tool production.
Global machine tool consumption was down $16.8 billion, or 20.1%, from 2019, the lowest level since 2009. But surprisingly, the effects of the economic lock-downs on the global machine tool market are not as severe as could have been expected. Photo Credit: Gardner Intelligence
The most surprising detail of global machine tool production was that China decreased production by just 1% to $19.4 billion from $19.6 billion. If China had decreased production by the average of the other top 15 producers (-19%), then its production would have been $15.9 billion. This would have sent global production down another $4.5 billion to its lowest level since 2004.
China’s Production Is Closing in on Its Consumption
As mentioned above, China’s machine tool consumption exceeded its production by the smallest amount since 1999. The difference was just $2.0 billion in 2020. A major reason for this small difference is that China’s machine tool production was virtually unchanged from 2019. Meanwhile, China’s consumption and production was surprising because China had one of the smallest contractions in machine tool consumption in 2020. These two factors sum to a narrowing of the gap between consumption and production.
Seemingly, China is relying more on domestic machine tool production to feed its machine tool consumption. Yet China continued to increase its exports as well. China’s machine tool exports increased nearly $1.6 billion, or 34%. Only one other country in the top 25 exporters increased their exports. That country was the Netherlands, which essentially serves as a pass-through country as it imports machines to export them to other parts of Europe. Only three of the remaining 23 countries in the top 25 exporters saw their exports contract less than 10%.
China’s dramatic increase in exports while the rest of the world was contracting suggests China is pursuing a different strategy than the five next largest producers. (Not so incidentally, the top five top producers after China are Germany, Japan, U.S., Italy, and South Korea, in that order. This marks the first time that the U.S. has been a top-four producer since 2015.) China’s largest export market is Vietnam, which accounts for 10.8% of China’s exports. By comparison, Italy’s largest market is the next smallest at 12.6%.
The other four countries’ top market represents at least 18.6% of each country’s exports, with Japan’s top market accounting for 30.9% of its exports. For three of the other top five producers, China is the country’s largest export market.
China has only one export market that accounts more than 10% of its overall exports. The other top producers have two countries that account more than 10% of exports, except for South Korea, which has three. Italy’s two export markets with more than 10% of its exports account for 23.7% of its total exports. The other countries all have at least 31% of their exports going to their top markets, while the U.S. and Japan top out at 51.3% of their exports going to their top two markets.
If we include the countries that account for at least 1% of a producer’s exports, China has 26 countries in this category. Italy and Germany have 23 and 24, respectively. The others have 15 or 16.
Alternately, we could count the number of countries that imported at least $5 million in machine tools from one of the major producers. China leads the way with 72 countries each importing this much of its machine tool output. Italy is next with 63. No other country has more than 60, and South Korea has just 30.
What is this telling us?
Germany, Japan, the U.S., Italy, and South Korea are primarily exporting to the other major industrialized countries or markets close to home. For example, 51.3% of U.S. machine tool exports go to Canada and Mexico. Roughly 50% of Germany’s exports go to other European countries. But for these top producing countries’ remaining exports, they are competing for and in the same markets.
However, China has a more diverse export market base. Its exports are not so heavily concentrated in a handful of countries. China is exporting smaller amounts to more countries. These additional countries are primarily in Asia or Africa. They are countries that China can use for low-cost manufacturing or may play a critical role for China as sources of raw materials or energy or export markets for other goods that China produces. As an example, for the two countries we added, Nigeria and Uzbekistan, China accounted for 20% and 45% of their machine tool imports, respectively.
One way to think of this is that in the 1960s and 1970s, the U.S. had a significant positive trade balance (meaning it exported more than it imported) in machine tools that helped cement its role as the global superpower. This trade balance also resulted in countries that were closely allied with U.S. foreign interests since these countries’ economic interests were aligned with the United States. Could China’s export strategy be viewed in a similar way? Many of these countries may seem small or insignificant to Westerners, but over the next 15 to 20 years as China’s status in the world continues to grow, the view of these countries may change. It is possible that China’s machine tool exports will help these countries industrialize, increasing their wealth and causing them to become allies with — or at least heavily reliant on — China.
The World Machine Tool Survey contains much more information, including not only consumption and production data, but also data related to imports and exports of the top 62 machine tool consuming countries. The report includes import and export data on high-level machine types. To purchase the report and the data supporting it, visit gardnerintelligence.com.
About the Survey
This is the 54th edition of an independent annual survey that collects statistics from machine tool consuming and producing countries and compares them in real U.S. dollars. It is conducted through the research department of Gardner Business Media Inc. (Cincinnati, Ohio) by Steven Kline, chief data officer. Data for this report come from research conducted by Gardner Intelligence.
Traditionally, Gardner collected actual or estimated data on production, exports and imports from 26 countries. However, beginning with the 2015 survey, actual import and export data were included for every country that imported at least $100 million of machine tools in at least one year since 2001. This change added 36 additional countries to the overall survey. Production was estimated for these recently added countries, although in a few instances the actual production data were found on government websites.
Consumption is calculated by adding imports to and subtracting exports from production figures. The data typically are reported in local currencies then converted to U.S. dollars. After this conversion, all data in this latest survey also were adjusted for inflation using the U.S. Bureau of Labor Statistics’ Producer Price Index for capital equipment. This adjustment promotes a more accurate historical comparison.
Sources of Data
Special assistance came from the 15-member CECIMO consortium (Brussels, Belgium) and AMT – The Association For Manufacturing Technology (McLean, Virginia). For countries that did not report, import and export data were gathered from the International Trade Centre.
Definitions
A machine tool is typically defined as a power-driven machine, not portable by hand and powered by an external source of energy. It is designed specifically for metalworking either by cutting, forming, physical-chemical processing or a combination of these techniques.
Machine tools traditionally are broken down into two categories: metalcutting and metal forming. Metalcutting machines typically cut away chips or swarf and include (but are not limited to) broaching machines, drilling machines, EDM units, lasers, gear-cutting machines, grinders, machining centers, milling machines, transfer machines and turning machines such as lathes. Metal-forming machines typically squeeze metal into shape and include (but are not limited to) bending machines, cold-heading machines, presses, shears, coil slitters and stamping machines.
Data presented in the World Machine Tool Survey are solicited for metalcutting machines (codes 8456-8461 under the Harmonized Tariff System) and for metal-forming machines (8462-8463), and are solicited for complete machines only, not including parts or rebuilt machines.
Exchange Rates
All data reported in domestic currencies are translated into U.S. dollars using the average daily exchange rate for the year (not the end-of-year rate) as reported by ofx.com. All analysis is done in real U.S. dollars.
Shipments Versus Orders
In addition to contributing statistics to this survey, many countries also track orders for new machine tools. These are, by their nature, different sets of numbers, and they may or may not be related. This survey is based on actual shipments of new machine tools from the factories in which they are produced. In contrast, the various order compilations in individual countries around the world are based on bookings for machines that will be shipped in the future. The time lag between these two events can vary greatly. An in-stock lathe might be shipped one day after the order is placed, whereas a complex engine-machining line might take a year to be delivered after the order has been received. On average in the United States, orders lead shipments by four to five months. That is likely a common lead time for other countries as well.
More in the Report
The World Machine Tool Survey contains much more information, including not only consumption and production data, but also data related to imports and exports of the top 60 machine consuming countries. The report includes import and export data on high-level machine types. To purchase the report and the data supporting it, click here.


Read Next

Shops Outside the Core Set of Buyers Are Driving Machine Tool Consumption
Spending by the so-called “marginal buyer” (typically a small shop that purchases machines on a discretionary basis) is the dominant factor in today’s market.
Read More
Machining Center Trends Have Implications For CAM
At a recent presentation where he described some developments in his company's CAM software, Delcam product manager Mark Forth spoke of two clear trends in the way machining centers are being used today. For one, high technology is moving into a broader range of applications.
Read More